A/B testing is meant to replace guesswork with evidence. But there can be a big gap between a statistically significant result in a report and a real business impact. An increase in conversion rate may turn out to be random noise, the result of a broken traffic split, or an effect that comes with a drop in average order value.
These mistakes can be costly: the team spends resources on unnecessary changes, marketing gets misleading signals, and the business ends up with an unexpected financial result. The problem starts when an A/B test is treated as a simple comparison of two conversion rates, ignoring the methodology behind the experiment.
A reliable experiment needs a clear hypothesis, a properly calculated sample size and rules for running and interpreting the test that are set in advance. In this article, we look at the main statistical and organisational pitfalls of A/B testing and how to turn experiment results into sound business decisions.
The reliability of an A/B test is largely decided before it even starts. If you don’t define the hypothesis, key metrics and rules of the experiment in advance, it’s easy to misread the data you get.
The "let’s change something and see what happens" approach risks producing a result that’s hard to explain. Before the test starts, write down a testable hypothesis using a simple template:
If we change X, it will affect Y, because Z.
For example: if we shorten the order form from 6 fields to 3, the conversion rate will increase because it will be easier for users to fill in.
You should also decide in advance what result would have practical value for the business and what minimum effect is worth detecting.
Conversion rate alone is often not enough to evaluate an experiment.
For example, a new page might increase the number of orders but reduce the average order value at the same time. If you only look at conversion rate, it’s easy to misinterpret this result. That’s why key metrics should be defined before the test starts, not picked after you’ve seen the results.
Don’t stop a test on the basis of "we’ve got 100 conversions – that’s enough". The required sample size depends on the baseline conversion rate, the expected effect, the acceptable level of statistical error and the desired statistical power.
A key concept here is MDE (Minimum Detectable Effect) – the smallest effect the test should be able to detect. It should be tied not only to statistics but also to the business value of the change: if a very small lift in a metric has no practical value, there’s no point designing an experiment around it.
So before you start, define the hypothesis, primary metric, minimum practically important effect and the amount of data you need. This sets clear rules for the experiment and reduces the risk of adjusting them to fit the result.
Even a well-planned A/B test can be ruined while data is being collected. The most common problems are stopping too early, external factors, an incorrect traffic split and hunting for a positive result among many comparisons.
If you check results every day and stop the test as soon as a statistically significant difference appears, you can mistake random fluctuation for a real effect. The more often you check the data without accounting for it in your statistical plan, the higher the risk of a false positive.
That’s why the sample size and stopping criteria must be set before launch. Don’t stop an experiment just because the p-value dropped below 0.05 today.
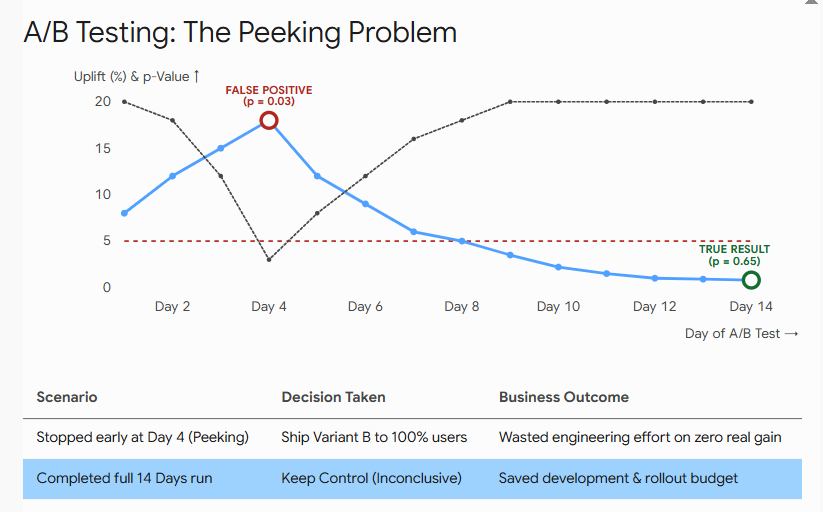
The comparison shows the business consequences of each decision:
A mid-test result isn’t necessarily the final result.
If the business needs to make decisions regularly before the planned end of a test, you can use sequential testing methods that account for repeated looks at the data.
A/B test results can be affected not only by the difference between variants but also by events around the experiment: ad campaigns, sales, holidays, technical failures or changes in traffic sources.
For example, a big promotion can bring atypical visitors to the site, and a payment system outage can lower conversion in both groups at the same time.
So the test duration shouldn’t be based on a universal "7 or 14 days" rule, but on the required sample size, seasonality and business cycles. If user behaviour varies a lot over the week, cover full cycles rather than ending the test in the middle of one.
For a valid A/B test, users must be randomly assigned to groups and, as a rule, stay in the same group throughout the experiment.
Before running more complex tests, an A/A test can be useful – both groups get the same variant. It helps you check the randomisation mechanics, tracking and any systematic issues.
You should also watch for Sample Ratio Mismatch (SRM) – when the actual split of users differs significantly from the planned one. For example, instead of the expected 50/50, the system consistently splits traffic 52/48.
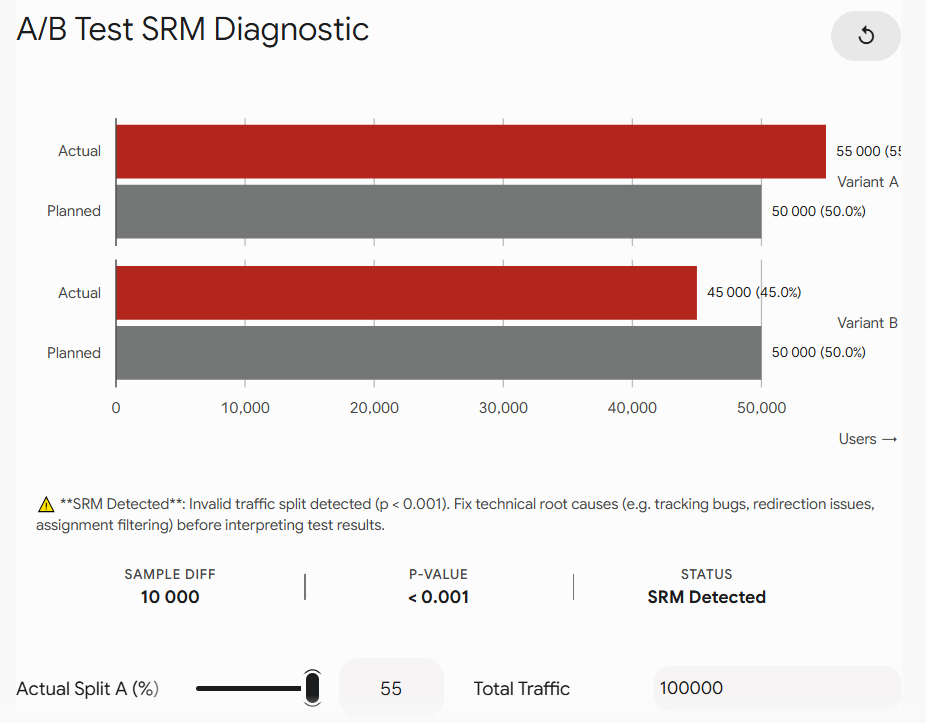
SRM can signal a technical problem, an error in the experiment logic or a quirk in data collection. Until the cause is found, the results of such a test should be interpreted with great caution.
Another trap is testing many variants at once, or checking dozens of segments after the experiment in search of a positive result.
The more independent comparisons you make, the higher the chance of getting a statistically significant result by accident. For example, if you check enough segments, you can find a group where B looks better purely because of statistical noise.
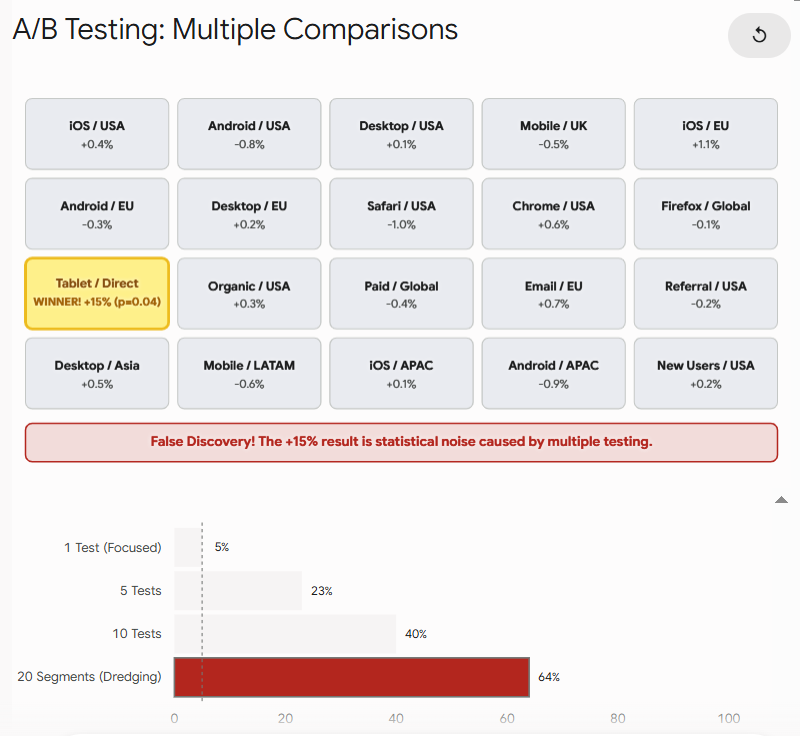
So important comparisons and segments should be defined before the test starts. If many hypotheses are tested at once, you may need multiple comparison corrections such as Bonferroni or FDR control.
A finished test and a statistically significant result don’t mean the change should be rolled out straight away. After the experiment, it’s important to assess not only the statistical result but also the effect size, its business value and the conditions under which it was obtained.
p < 0.05 means that, under the given statistical model, the observed data would be unlikely if there were no effect. But on its own, this value doesn’t tell you the size of the effect or its economic value.
With a large sample, even a very small increase in conversion rate can become statistically significant. So after the test, assess:
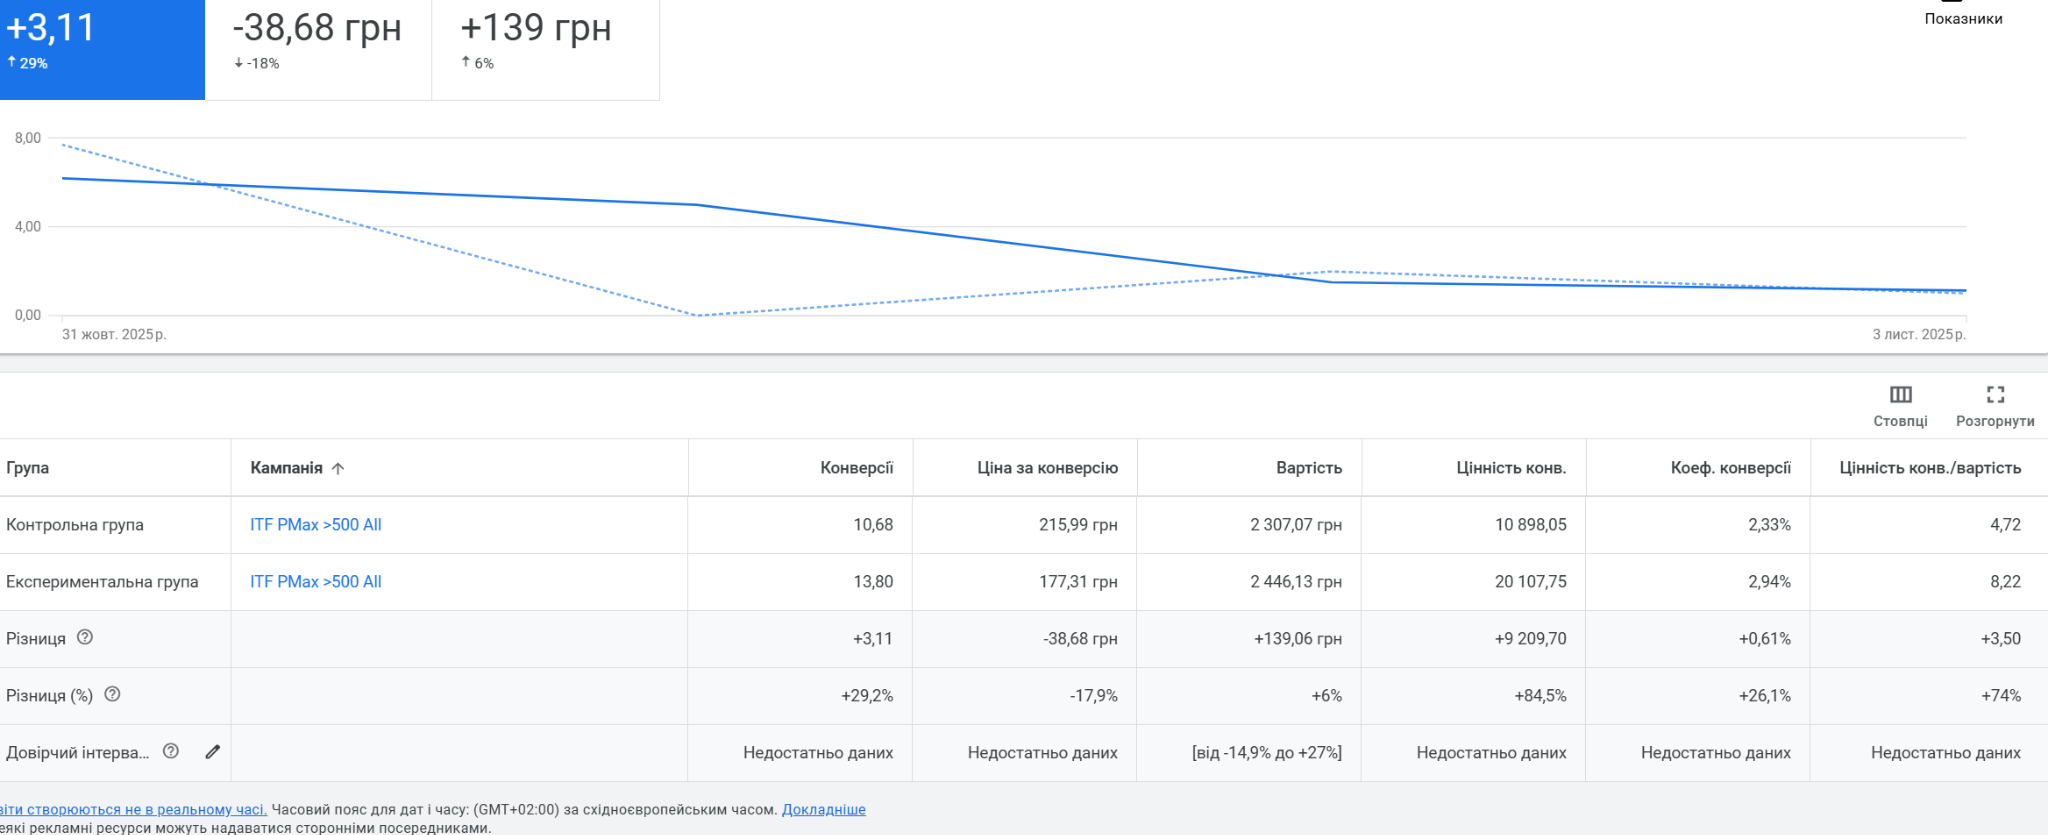
Screenshot from Google Ads Experiments: the illusion of a quick win. Despite an impressive lift (ROAS +74%), the system warns that there isn’t enough data yet. Stopping the test at this point would lead to statistically unreliable conclusions.
The MDE is defined before the test starts as the minimum effect that matters to the business. If a statistically significant result turns out to be much smaller than this benchmark, that’s a reason to reassess whether the change is worth it – not just to declare B the winner.
A properly randomised A/B test lets you draw a causal conclusion: under the conditions of the experiment, change X caused change Y.
But that result won’t necessarily be the same for every audience at every moment. The effect can differ depending on:
So it’s better to phrase the conclusion precisely: "In this experiment, change X increased Y", rather than "this change always increases Y".
After a test, it’s easy to find a positive result in some segment if you check enough of them: devices, countries, traffic sources and so on.
If a segment was defined before the test started and had its own hypothesis, analysing it is well justified. But if, after seeing the overall result, you check dozens of segments and pick the one that happened to show +15%, that may simply be an effect of multiple testing. So unexpected segment findings are better treated as new hypotheses to test, not as ready-made proof for rollout.
It’s also worth checking traffic composition: if the shares of different user types in groups A and B differ noticeably, this can affect the overall result and needs a separate check.
The first results after an interface change don’t always reflect its long-term effect. Users may react to a new element temporarily simply because it’s unfamiliar, or because they’re adapting to the change.
So for important changes, assess the stability of the effect over the course of the test, and if needed, analyse the behaviour of different cohorts and key metrics after the experiment ends.
In short, an A/B test result shouldn’t be judged by a single p-value but by the effect size, its uncertainty, business value, data quality and stability of the result taken together.
After analysing the results, you need to decide on the next step. It depends not only on which variant showed the better metric but also on statistical uncertainty, data quality and business impact.
If B shows a statistically significant effect, check the following before rolling it out:
For example, a 5% increase in conversion rate may look good, but if the average order value dropped at the same time, the overall business impact may be different.
So the decision to roll out should be based on the full set of metrics, the effect size, its uncertainty and business value, not just the p-value.
p ≥ 0.05 doesn’t prove that A and B are the same. It means that within this experiment there wasn’t enough statistical evidence to confirm a difference between the variants.
Before deciding, check:
If the test was underpowered and the potential effect matters to the business, you can repeat the experiment with a properly calculated sample size. If the test was well planned and no practically important effect was found, that may be grounds to postpone the change or revisit the hypothesis.
A negative result is a normal part of experimentation. If no technical or methodological problems were found, it means the specific change didn’t deliver the expected result under the conditions of this experiment.
Don’t try to "rescue" the hypothesis by searching for a random positive segment. Instead, use the data to shape your next hypothesis, or drop the change.
The key principle: an A/B test result isn’t just an answer to "A or B". It’s the basis for the next decision: roll out the change, repeat the test, change the hypothesis or abandon it.
Before using an A/B test result for a business decision, check the core conditions of the experiment.
The golden rule: don’t judge a test only by whether the p-value dropped below 0.05. Before deciding, check data quality, statistical uncertainty, effect size, business value and the impact on other metrics.
A/B testing is a way to test hypotheses against data, not a tool for confirming a decision you’ve already made. Even a statistically significant result may not be valuable enough for the business if the effect is too small, the data was collected incorrectly or the change hurts other important metrics.
The reliability of an experiment is built at every stage: from a clear hypothesis, metric selection and sample size calculation to running the test properly and interpreting the results carefully. Don’t stop a test because of a temporary positive result, don’t go looking for a positive segment after the fact, and don’t confuse a lack of statistical significance with proof that the variants are the same.
The key principle: a good A/B test has rules set in advance, and the conclusion follows from the results – not the other way round. Sometimes the outcome will be rolling out variant B, sometimes repeating the test, changing the hypothesis or dropping it. In every case, the value of the experiment is that the decision is based on data rather than assumptions.
Any A/B test is only as reliable as the analytics behind it. If you need to set up event and conversion tracking before running experiments, see our web analytics setup service.