
A conversation about campaign targets almost always starts the same way. The client names a number: “we need leads at 200 hryvnia” or “we want 800% ROAS”. The next question — where exactly that number came from — usually goes unanswered. It was carried over from someone else’s case study, remembered from last year when the auction was different, or produced by dividing a desired profit by a desired number of orders.
The problem is not that the number is ambitious. The problem is that nothing leads to it. It can be neither confirmed nor disproved before launch — and three months later it turns into a conflict in which both sides are right: the agency shows growth, the client shows losses.
A realistic KPI is calculated differently — not from a wish, but from the economics of the business. Below is the step-by-step method we use to set targets before launching paid search: from the contribution margin on a single order to the range of leads a given budget will produce. Every formula can be worked out on a sheet of paper in half an hour, provided the business has the input data. If it doesn’t, that is the first conclusion of the exercise — and it matters more than any forecast.
There are three typical sources for the number a business names as its goal.
Someone else’s case study. A competitor or a blogger wrote that they get leads at $3. No margin is given, no geography, no season, no word on whether unqualified enquiries were counted, no mention of whether the agency fee was included. A number without context does not transfer to another business, not even in the same niche.
Last year’s result. "Last year we were getting enquiries at 150 hryvnia." This is the most dangerous kind of target, because it looks well-founded. But the Google auction is not a price list: the number of advertisers, their budgets, their bidding strategies and even the SERP formats change every quarter. The cost per click last year and the cost per click now are different quantities even for the same keywords — something our case studies make visible.
Working backwards from a wish. "I want 50 orders a month on a budget of 30 thousand, so leads have to cost 300 hryvnia." There is no economics here at all: a desired volume and a desired spend joined by arithmetic. The question of whether the business can afford a 300-hryvnia lead in the first place was never asked.
All three have one thing in common: the target was imported from outside rather than derived from the numbers of the business itself. The correct order is the reverse — first work out how much the business can pay, and only then look at whether the auction allows it.
A realistic KPI is not one number. It is two different things that are routinely confused.
The ceiling is how much a business can pay per order without losing money. It follows purely from economics: margin, close rate, repeat purchases. The auction, the channel and the agency have nothing to do with it — the ceiling is the same for Google Ads as it is for cold calling. It is the upper bound past which acquisition stops making sense.
The range is how many leads a specific budget actually produces in a specific niche at the site’s current conversion rate. That is a market question, and that is exactly why it is a range and not a number: every impression is auctioned separately, demand fluctuates week to week and season to season, and competitors enter and leave the auction without notice.
The KPI emerges where the two meet. If the ceiling sits above the lower bound of the range, advertising makes sense and a target figure can be fixed inside that corridor. If the ceiling sits below the entire range, this is not a campaign-setup problem but a business-economics problem — and it is better to know that before launch.
This distinction is also why we do not produce media plans. A forecast table describes the behaviour of an auction that none of its participants controls. The ceiling, by contrast, belongs to the business itself: it does not depend on competitors, on the season, or on who runs the campaigns — which is precisely why it is the right place to start. We set out this position in full on our paid search services page.
The starting point of the whole calculation is how much money the business keeps from one order. Not a percentage but an amount: you will be paying for leads in currency.
That does not mean percentages are useless. Nobody is going to cost out every single item for a store with a thousand SKUs or a clinic with a hundred services — nor should they. A percentage is a perfectly good input; you just cannot stop there. Margin percentage gets multiplied by the average order value, and it is the resulting amount that goes into the rest of the model.
The formula is simple:
Contribution margin = average order value − cost of goods − variable costs per order
Variable costs are everything that exists because of a specific order and disappears if the order does not happen: delivery or a site visit, payment processing fees, packaging, marketplace commission, returns and warranty cases expressed per unit.
Fixed costs — rent, salaries, accounting, CRM — do not belong in this formula. They are a separate line covered by the total contribution margin for the month. Folding fixed costs into the cost of a single order is the number one reason businesses understate their own allowable CAC and then cannot find a single channel that "pays for itself".
| Metric | Example: a service | Example: a product |
|---|---|---|
| Average order value | 60,000 UAH | 2,400 UAH |
| Cost of goods (materials, labour, purchase) | 42,000 UAH | 1,560 UAH |
| Variable costs (logistics, processing, returns) | 1,800 UAH | 240 UAH |
| Contribution margin | 16,200 UAH | 600 UAH |
| Margin as % of order value | 27% | 25% |
The figures in the table are illustrative — they show the logic, they are not benchmarks. The service example is carried through to the end of the article.
When there are many items. In e-commerce and in healthcare, per-item calculation is replaced by a single number: margin weighted by revenue. By revenue specifically, not a simple average across categories — categories sell in very different volumes, and a simple average almost always flatters the result.
| Category | Share of revenue | Margin |
|---|---|---|
| A | 20% | 40% |
| B | 30% | 25% |
| C | 50% | 12% |
| Revenue-weighted margin | 21.5% against 25.7% on a simple average | |
Four percentage points look harmless, but they inflate the allowable cost per enquiry by roughly 20% — and that is the order of magnitude at which the calculation stops adding up. Take the shares from actual quarterly revenue, and preferably from revenue generated by paid traffic if its mix differs from your overall sales.
A separate word on spread. If categories range from 12% to 40%, a single averaged number hides the important part: under one shared target, half the range is being advertised at a loss. Break-even ROAS for a 12% margin category is 833%; for a 40% category it is 250%. That is not a reason to look for a more precise average — it is a reason to split campaigns by margin band and give each its own target. In healthcare the same problem takes a different shape: if the first purchase is a minimum-margin consultation and the money comes from a course of treatment, costing the model on the consultation means declaring the advertising unprofitable before it starts. Businesses like that are handled through step 5, not through the first-visit order value.
And a word on returns. If 12% of orders come back in your niche, your actual contribution margin is not 12% lower: you paid acquisition costs on 100% of the orders and earned margin on 88%. The correct place for returns is inside variable costs per unit, not "we’ll account for that somewhere later".
Advertising brings leads. Sales bring money. Between those two events sit two coefficients, without which any cost per lead is a meaningless number.
Junk lead share. How many enquiries are not potential customers at all: spam, misdials, out-of-area requests, requests for a service you do not offer, repeat contacts from existing customers. In lead generation this is typically 15–35%, depending on the niche and how broadly the keywords are set. We will use 20% in the example.
Close rate on qualified leads. How many genuine prospects reach payment. Take it from the CRM over at least three months, separately for paid traffic — leads from ads almost always close worse than leads from referrals.
| Stage | Value | Count |
|---|---|---|
| Leads from ads | — | 100 |
| Junk (unqualified, out of area, spam) | 20% | −20 |
| Qualified leads | — | 80 |
| Close rate | 30% | 24 |
| End-to-end lead-to-sale conversion | 24% | |
Twenty-four percent is the coefficient that later turns an allowable cost per customer into an allowable cost per lead. Note that in niches with a short cycle and a low order value it will be several times lower, and that is fine — what matters is not the figure itself but that it came from actual data rather than a guess.
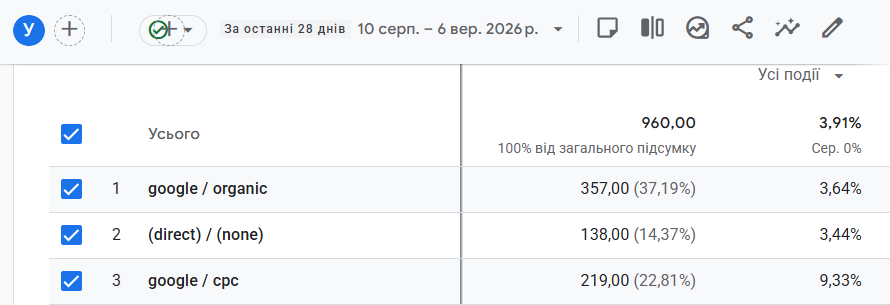
The screenshot clearly shows the google / cpc row and a separate conversion / engagement rate for paid traffic (9.33%) that differs substantially from organic (google / organic — 3.64%) and direct (direct / none — 3.44%). That is direct confirmation of why this data has to be read for paid traffic separately rather than averaged across the whole site.
If there is no CRM and the business knows none of these numbers, that is not a reason to skip the step. It means the first task before launching ads is not campaigns but recording enquiries and their statuses. Otherwise, two months later there will be no way to tell "the ads bring unqualified people" apart from "the sales team doesn’t call back". The minimum working setup is correctly configured analytics plus any CRM with deal statuses.
Now we join the first two steps. The contribution margin on one order is the entire pool from which customer acquisition can be paid for. The only question is what share of it the business is willing to give up.
A word on terminology first, because this is a regular source of confusion. From here on we say CAC — the cost of acquiring a customer, meaning someone who paid. Not CPA: in Google Ads, CPA means the cost of a conversion, whatever that conversion happens to be, and if your configured conversion is "enquiry", then the CPA in the interface is your cost per lead. On top of that, account-level CPA is usually averaged across several actions at once, including micro-conversions such as a click on a phone number. We need a different number: what one validated customer costs, accounting for junk leads and every cost of running the channel.
A clarification for the finance team: in its classic sense, CAC also includes sales salaries, CRM and other acquisition costs. We calculate channel CAC — only what goes into advertising. If your CFO works with full CAC, the two numbers will not match, and the difference needs to be agreed up front.
Three levels of CAC follow, and they must not be confused.
Break-even CAC equals the entire contribution margin. In our example, 16,200 UAH. This is the point where advertising brings the business nothing: every unit spent comes back as a unit of margin, and fixed costs remain uncovered. You need this number not as a target but to know where the cliff edge is.
Target CAC is the share of margin the business deliberately allocates to acquisition. Our working benchmark for lead generation is 25–40% of contribution margin: that is the corridor in which the economics of the projects we run stay stable over time. It shifts upward if the business has repeat purchases or a long service cycle, and downward if the contribution margin has to cover heavy fixed costs or the business carries significant debt. In our example we take 30%: 16,200 × 0.3 = 4,860 UAH.
Growth CAC is a deliberately higher ceiling for a limited period, when a business is buying market share or a customer base. Say 45% of margin: 7,290 UAH. It is a legitimate instrument, but only with a predefined end date and exit criterion — otherwise "temporarily aggressive CAC" becomes permanent.
| Level | Share of margin | CAC | When it applies |
|---|---|---|---|
| Break-even | 100% | 16,200 UAH | Never as a target — only as a limit |
| Growth | 45% | 7,290 UAH | A capped period of taking market share |
| Target | 30% | 4,860 UAH | The standing working target |
And the clarification that saves you from the most expensive mistake in this calculation. Channel CAC includes all costs of running the channel, not just the ad budget: the agency fee, taxes and payment-system commissions on account top-ups, tooling. Calculated "on the Google budget alone", it is understated by 20–40% — and that gap is exactly where the P&L later fails to reconcile.
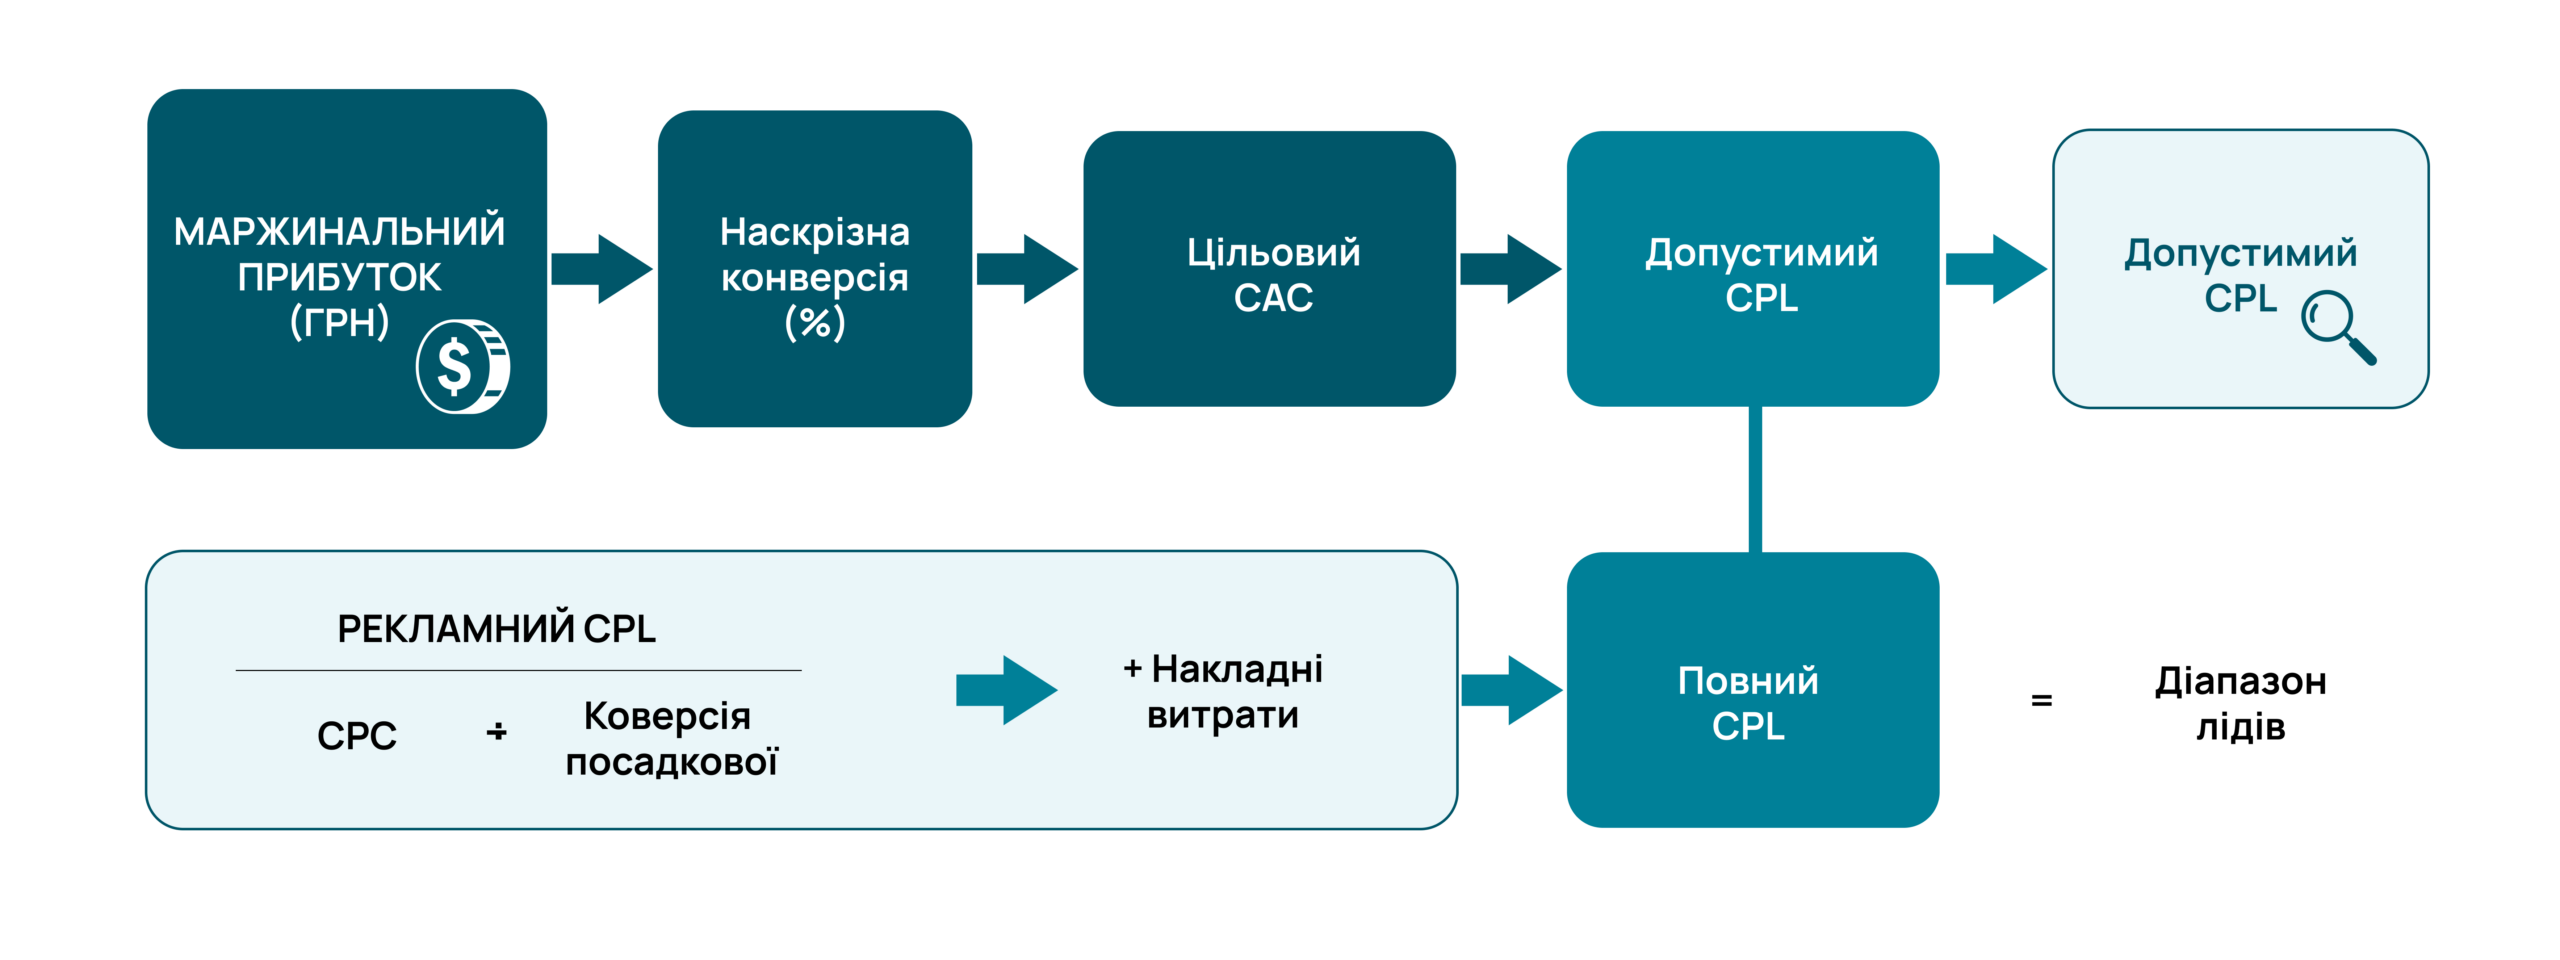
CAC is the cost of a customer. Advertising, though, optimises towards leads, and it is cost per lead that appears in day-to-day account work and in the agency contract. The bridge between them is the end-to-end conversion from step 2:
Allowable CPL = allowable CAC × lead-to-sale conversion
In our example:
| Level | CAC | × end-to-end 24% | Allowable CPL |
|---|---|---|---|
| Break-even | 16,200 UAH | ×0.24 | 3,888 UAH |
| Growth | 7,290 UAH | ×0.24 | 1,750 UAH |
| Target | 4,860 UAH | ×0.24 | 1,166 UAH |
1,166 UAH per lead is the figure worth naming as a KPI. Not "we want 200", not "the competitor gets 150", but a quantity derived from margin and from the sales team’s actual close rate.
Now the interesting part — the sensitivity of this formula. Allowable CPL is directly proportional to close rate. Which means working on the sales team produces exactly the same effect as making traffic cheaper, except that it depends on the business itself and usually happens faster.
Raise the close rate in our example from 30% to 35% and end-to-end conversion goes from 24% to 28%, lifting allowable CPL from 1,166 to 1,361 UAH. That is +17% with no change to the advertising at all. You can ask an agency to make leads 17% cheaper, but that is work at the edge of what the account can do, whereas teaching your team to call back in five minutes instead of two hours is a week’s work.
The same lever works in reverse: if the junk lead share rises from 20% to 35%, end-to-end conversion falls to 19.5% and allowable CPL drops to 948 UAH. Which is why "let’s broaden the keywords so we get more enquiries" is a decision to be judged not by lead count but by that number.
The logic "we can afford a more expensive customer because they’ll come back" is sound. But only when it rests on actual cohorts rather than on hopes.
The minimum required: the real share of customers who made a second purchase, and the average number of purchases within a fixed window — 6 or 12 months. Not "over a customer’s lifetime", not "the market average".
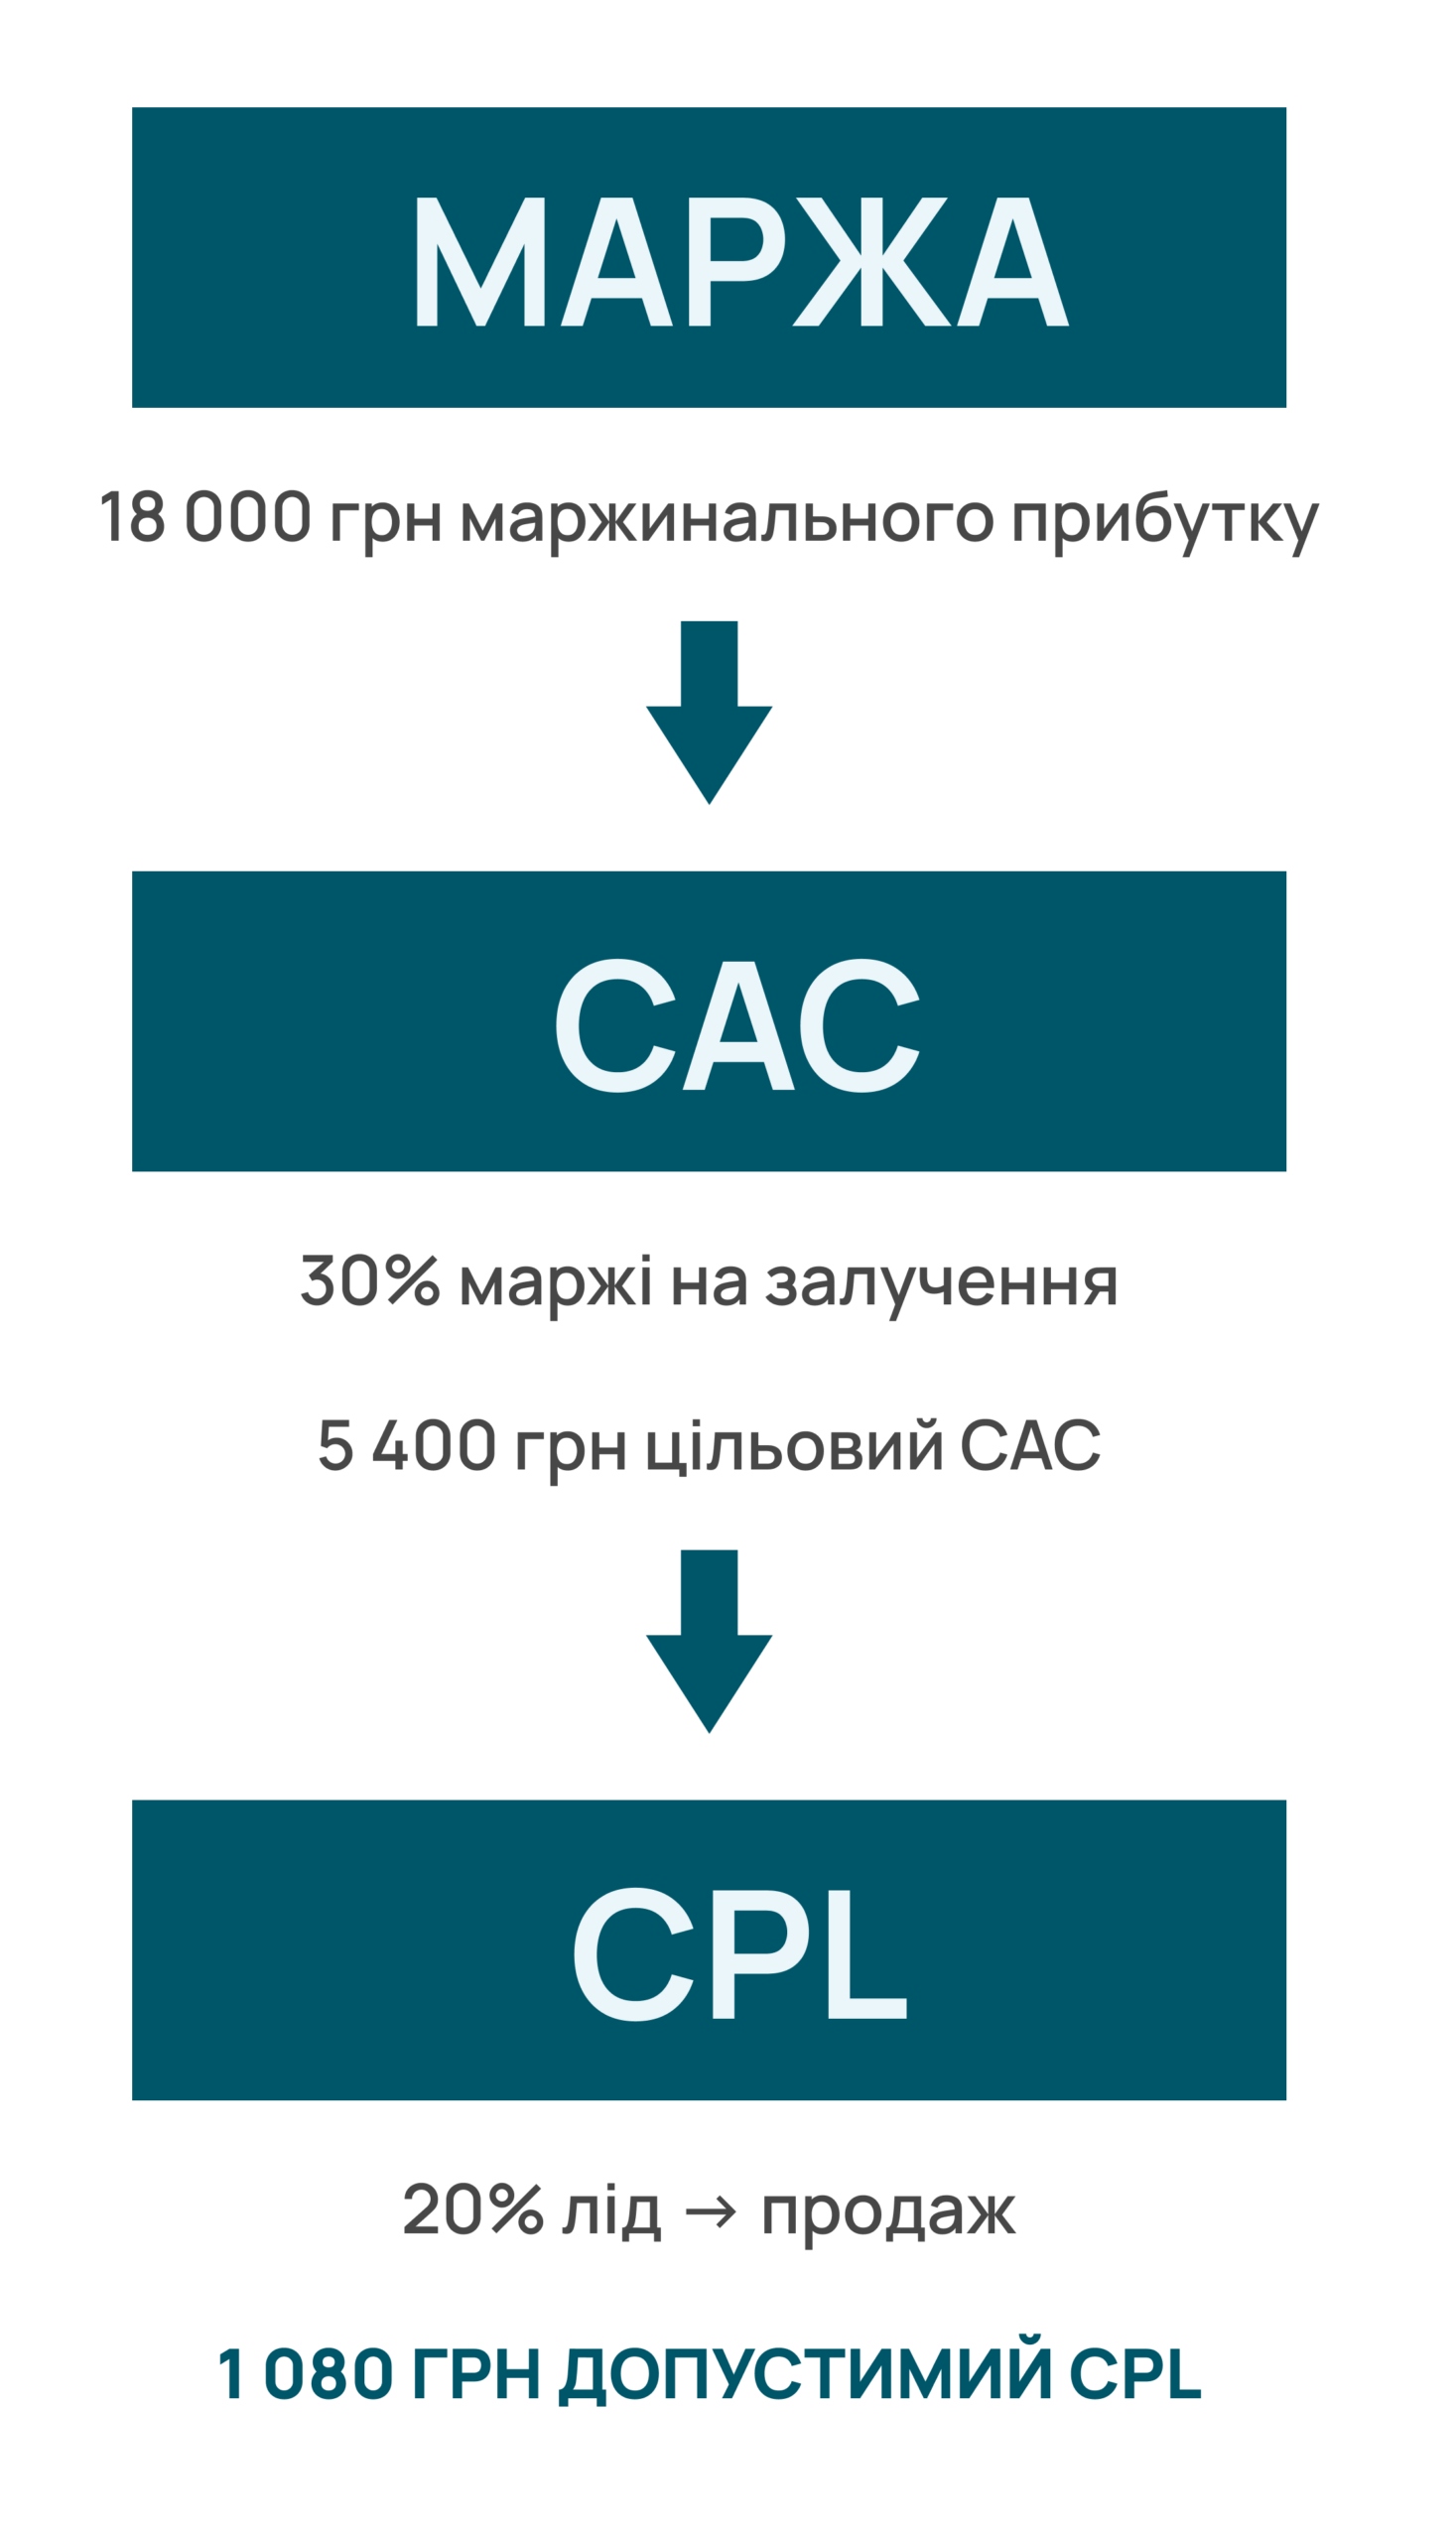
The arithmetic runs like this. If 30% of customers return and make on average another 1.8 purchases within 12 months at the same contribution margin, then the margin from one acquired customer is not 16,200 but 16,200 × (1 + 0.3 × 1.8) = 24,948 UAH. Target CAC accordingly rises from 4,860 to 7,484 UAH, and allowable CPL from 1,166 to 1,796 UAH.
A reasonable objection appears here: why raise the allowable cost per lead at all? Let the lower figure stand — it is safer.
Safer, and smaller. Allowable CPL is a ceiling, not the price you will pay. You pay whatever the auction costs; the ceiling only determines which auctions the algorithm enters at all. Lower it and automated bidding simply stops buying the more expensive segments: competitive queries, higher-spending audiences, peak demand hours. The budget will not be spent in full, and order volume runs into the narrow slice of the market that fits under the ceiling.
In our example the difference looks like this. Suppose that at a full cost per lead of 1,166 UAH the niche yields around 55 enquiries a month — cheaper demand simply does not exist.
| Monthly figure | Ceiling 1,166 UAH | Ceiling 1,796 UAH |
|---|---|---|
| Actual full CPL | 1,166 UAH | 1,250 UAH |
| Leads | 55 | 100 |
| Sales | 13 | 24 |
| Total channel spend | 64,000 UAH | 125,000 UAH |
| Actual CAC | 4,860 UAH (30% of margin) | 5,200 UAH (32% of margin) |
| Contribution margin | 214,000 UAH | 389,000 UAH |
| Left after channel spend | 150,000 UAH | 264,000 UAH |
Note the paradox: per-order profitability in the narrow scenario is actually better — an actual CAC of 4,860 UAH, exactly the target 30% of margin against 32% in the wider one. And the business ends up with almost half the money. Better percentage, worse amount.
That is the balance LTV is calculated for: not "permission to overpay" but wider access to demand while staying in profit. A ceiling set too low does not make advertising more profitable — it makes it smaller.
Three constraints, without which this calculation becomes self-deception:
The practical option for most businesses is to run two different CAC figures: a higher one for a new customer’s first order and a lower one for segments with no repeat purchases. In Google Ads this is separated at campaign and audience level.
An online store has no leads in the classic sense — it has orders and revenue. The logic is identical; only the unit of measurement changes.
Break-even ROAS = 1 ÷ margin
Margin here is the same share of revenue left after cost of goods and variable costs. Its mirror image is ad spend as a share of revenue: at break-even the two are equal. Internationally this ratio is known as ACoS; we write it out in full to avoid confusion.
| Margin | Break-even ROAS | Spend as % of revenue | Target ROAS
(half the margin to ads) |
Target spend share |
|---|---|---|---|---|
| 10% | 1000% | 10% | 2000% | 5% |
| 15% | 667% | 15% | 1333% | 7.5% |
| 20% | 500% | 20% | 1000% | 10% |
| 25% | 400% | 25% | 800% | 12.5% |
| 30% | 333% | 30% | 667% | 15% |
| 40% | 250% | 40% | 500% | 20% |
| 50% | 200% | 50% | 400% | 25% |
The table shows the essential point: a ROAS figure on its own means nothing. 800% ROAS at a 25% margin is exactly the point where half the margin goes to advertising — a workable target. The same 800% at a 10% margin is a loss, because break-even only arrives at 1000%. Conversely, a "modest" 300% at a 50% margin leaves the business two thirds of its margin.
So "I want ROAS no lower than 800%" without a stated margin is not a KPI — it is a number. You can work out your own benchmark quickly in our ROAS calculator.
Repeat purchases matter here too — but, unlike in lead generation, they work the other way. There, LTV raised the ceiling on allowable CPL. Here it lowers the floor on ROAS: you can accept a lower figure in the report, because the real revenue from that customer will exceed what Google credited itself with.
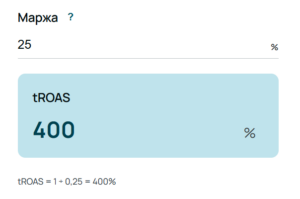
Break-even ROAS including repeats = 1 ÷ (margin × K)
where K is the repeat-purchase coefficient: K = 1 + share of returning customers × average number of repeat purchases in 12 months. For the same 30% and 1.8 purchases as in step 5, K = 1.54.
| Margin | Break-even ROAS, repeats excluded | Same with K = 1.54 |
|---|---|---|
| 10% | 1000% | 649% |
| 20% | 500% | 325% |
| 30% | 333% | 216% |
| 40% | 250% | 162% |
| 50% | 200% | 130% |
The difference is dramatic: a store on a 30% margin with a normal repeat share breaks even at 216% rather than 333%. In practice that means target ROAS can be set lower — and campaigns gain access to audiences a stricter target would simply never have bought. The mechanism is the same as with the CPL ceiling: the number in the settings controls not price but the volume of demand you can reach.
Two caveats. First, K comes from a cohort report, not from expectations; everything said about that in step 5 applies to e-commerce as well, cash flow included. Second, a lowered target ROAS must not be applied to campaigns working mainly with the existing base: there, repeat purchases are already inside the reported revenue, and counting them twice means paying twice for the same customer. If growing the base is the actual goal, the cleaner move is not to lower the target overall but to raise the value of a new customer separately — Shopping and Performance Max have a new-customer acquisition goal for exactly this.
Three details that eat e-commerce calculations more often than anything else:
So far we have calculated from the top down, from economics. Now the same thing has to be calculated from the bottom up, from the market side, to see whether the two models meet. This is the most important moment in the whole exercise — and the one where mistakes are most often made.
The mistake is this. Clicks are paid for only out of the ad budget. The agency fee, taxes and top-up commissions buy no clicks at all — but they do form part of the cost per lead as the business experiences it. So there are two costs per lead, and they must not be mixed up:
Ad-budget CPL = CPC ÷ landing page conversion rate
This is cost per lead from the budget’s point of view. It determines how many enquiries you will get at all.
Full CPL = ad-budget CPL × overhead coefficient
This is cost per lead from the business’s point of view. This is what gets compared against the ceiling from step 4. The overhead coefficient is total channel spend divided by the ad budget.
Continuing the example. The Google budget is 100,000 UAH a month, management is 23,000, commissions and taxes on top-ups are 2% of budget. Total spend comes to 125,000 UAH and the overhead coefficient to 1.25.
| Item | Per month |
|---|---|
| Ad budget (buys clicks) | 100,000 UAH |
| Commissions and taxes, 2% | 2,000 UAH |
| Agency fee | 23,000 UAH |
| Total channel spend | 125,000 UAH |
| Overhead coefficient | 1.25 |
Now the market side. Suppose CPC in the niche is around 50 UAH — roughly $1.2, the median for the Ukrainian auction — and the landing page converts paid traffic at 5%. Both figures have to be real: cost per click from the planner or from the account’s own data, landing page conversion from analytics, measured on paid traffic specifically (it is almost always below the site’s overall rate).
50 ÷ 0.05 = 1,000 UAH ad-budget CPL
1,000 × 1.25 = 1,250 UAH full CPL
Compare that to the allowable 1,166 UAH from step 4. There is a gap, but it is 7% — closed either by lifting landing page conversion by half a point, or by accepting an actual CAC of 32% of margin instead of the planned 30%. This is a normal working scenario: the models meet, and the KPI is fixed in a corridor of 1,150–1,300 UAH full cost per lead.
Notice how expensive the confusion alone is. Had we compared the ceiling against the ad-budget CPL — 1,000 against 1,166 — it would have looked as though the market is cheaper than our limit and all is well. In reality the 14% headroom is consumed by overheads entirely. That quarter is precisely the amount by which calculations "add up" on paper and fall apart in the P&L.
Now imagine the landing page converts at 1.5% rather than 5%: the bottom-up figure becomes 3,333 UAH ad-budget CPL, or 4,167 full. That is no longer 7% but three and a half times over, and in that case the allowable CAC exceeds the entire contribution margin on an order. No amount of "better campaign setup" closes a gap like that.
The difficulty is telling the first case from the second when you run this calculation for the first time. A 14% gap and a threefold gap are equally alarming until you have something to compare them with. That is why we maintain our own database of CPC, CPA, ROAS and CAC by niche — built from 2,000+ projects and topped up from the accounts we run today. When a client names a desired cost per enquiry, we look not only at their economics but at whether such a figure exists in their niche at all. The answer "we have never once seen that" is unpleasant to hear — but it is heard in negotiations rather than in month three.
A few reference points for a sanity check — the order of click prices we see in the Ukrainian search auction in 2026:
| Segment | Indicative CPC, Ukraine |
|---|---|
| Median across all niches | around $1.2 |
| Legal services | around $4 |
| Healthcare | around $3 |
| B2B SaaS | $2.5–3 |
| Ecommerce | $0.8–1 |
| Travel | $0.5–0.8 |
These are reference points rather than promised values: advertising outside the capital is usually about a third cheaper, brand queries cost a fraction of competitive commercial ones, and within a single niche the spread between narrow and broad keyword sets can be twofold. These numbers date faster than anything else in this article — we review them quarterly.
The final step is arithmetically the simplest — you just have to pick the right one of the two costs per lead:
Number of leads = ad budget ÷ ad-budget CPL
The ad budget, not total spend; and the ad-budget CPL, not the full one. Dividing total spend by the ad-budget CPL is the classic error, and it inflates volume by exactly the overhead coefficient: in our example, 25 enquiries a month that will not arrive.
In the example: 100,000 ÷ 1,000 = 100 leads. The full cost of each is 1,250 UAH, because the business spent 125,000 in total.
The result has to be presented as a range, and there are three separate reasons for that, each adding its own spread:
| Scenario | Ad-budget CPL | Leads | Full CPL | Sales (24%) |
|---|---|---|---|---|
| Months 1–2, learning period | 1,300 UAH | 77 | 1,625 UAH | 18 |
| Pessimistic | 1,200 UAH | 83 | 1,500 UAH | 20 |
| Base | 1,000 UAH | 100 | 1,250 UAH | 24 |
| Optimistic | 850 UAH | 118 | 1,063 UAH | 28 |
A range like this is not an attempt to hedge with vague wording. Cost per click is not a fixed quantity you can look up in a price list: it is assembled afresh every time, for a specific user, and depends on who else is fighting for that same impression in that same second. A single number instead of a corridor would be an invention here — even if it happens to come true later. A corridor, by contrast, gives you something to compare the actuals against, which is exactly why results are judged on trend rather than on a single month.
Let us sanity-check the base scenario: 100 leads × 24% = 24 sales × 16,200 UAH of margin ≈ 389,000 UAH of contribution margin against 125,000 of channel spend. Actual CAC comes out at around 5,200 UAH — 32% of margin against a 30% target and a 100% break-even. The model holds.
The method above works for any business, but in B2B half the inputs behave differently. The formulas are the same — what behaves differently are the numbers you put into them.
1. The conversion window is shorter than the sales cycle. In Google Ads the click-through conversion window can be set anywhere from 1 to 90 days, with a default of 30. A B2B deal closes in two to six months. A sale that happens on day 120 after the click will never appear in the campaign report — under any configuration.
Two things follow in practice. First: a close rate calculated on the current month is structurally understated — it has to be taken from a cohort of leads old enough to match your cycle length. Second: optimising campaigns towards the deal itself will not work, because the algorithm cannot see it.
2. One lead is not one person. A single deal often generates several enquiries: first a specialist, then a manager, then someone from procurement. Counting them as separate leads makes CPL look lower than it is and the close rate several times worse than it is. Deduplication by company domain happens before the calculation, not after.
3. The junk share is higher. The 15–35% from step 2 is a B2C benchmark. In B2B, ordinary spam is joined by students doing coursework, competitors, job applicants and vendors looking for someone to sell to. The realistic corridor is 30–50%, and without statuses in the CRM that number will never surface.
4. Margin is calculated on the contract, not on the first deal. A pilot or a first small project is often taken at minimum margin, with the money coming from renewal. This is the same situation as the consultation in step 1: cost the model on the first deal and the advertising will look unprofitable before it starts. Businesses like this are handled through step 5, and the horizon is longer — 12 to 24 months rather than twelve.
5. Lead volume is too low for the algorithm. Ten to fifteen enquiries a month is a normal B2B figure and not enough for Smart Bidding to exit learning on closed deals. Optimisation has to target an intermediate action instead: a proposal request, a booked call, a materials download. That changes what can be written into the campaign KPI at all — the account goal and the business goal are different things here by definition, and the difference has to be agreed before launch rather than after the first report.
6. The range is wider and the assessment period is longer. The median 15% fluctuation from step 8 applies to accounts with hundreds of conversions a month. At ten leads, one atypical week shifts the monthly figure by 30–40%. A quarter here is not a recommendation but the minimum unit in which the numbers mean anything.
| Metric | B2C | B2B |
|---|---|---|
| Cycle to close | Hours to days | 2–6 months and up |
| Conversion window in Google Ads | 30 days is enough | 90 days is the maximum, and it is not enough |
| Leads per deal | One | Several people from one company |
| Junk lead share | 15–35% | 30–50% |
| Margin horizon | First deal | Contract, 12–24 months |
| Target conversion in the account | Enquiry or sale | Intermediate action: proposal request, booked call |
| Unit of assessment | Month | Quarter |
The summary for the calculation: in B2B take the close rate from a cohort, deduplicate leads by company, budget for a higher junk share and a longer margin horizon, and do not make the deal your target conversion in the account until volume allows it. Everything else in the method stays as it is.
How this plays out at strategy level is set out on our B2B SEO page, and worked examples from real projects are collected in our B2B case studies.
The most common outcome of an honest calculation is an allowable CPL below the market rate. That is not a reason to look for an agency that will promise the number you want. It is an input condition to work with, and there are four sides to work from.
Landing page conversion and lead response time. The fastest lever, because it sits entirely inside the business. Lifting conversion from 2% to 3% makes a lead a third cheaper — more than most in-account optimisation delivers. The same applies to time to first contact: in many niches the difference between calling back in 5 minutes and in 2 hours is a twofold difference in close rate.
Average order value and order structure. Upsells, bundles, minimum order values, premium items in the range. Every unit added to the average order value at unchanged cost of goods goes straight into contribution margin, and therefore into allowable CPL.
Narrowing, not broadening. Intuition says "add keywords so we get more enquiries" — but if the economics do not add up, the correct move is the opposite: keep only the highest-spending segments, a tighter geography, hot commercial queries. There will be fewer leads, but each one will fit under the ceiling. This is a perfectly normal strategy for launching on a limited budget.
Changing the channel or the model. If the gap remains a multiple after every lever, paid search in this niche at this margin simply does not pay for itself. The conversation then moves to other channels: organic traffic on a longer horizon, work with the existing base, partnership models. "You don’t need paid search right now" is also a result of the calculation, and it is better arrived at before launch than after three months of spend.
A target calculated before the start is a hypothesis, not a commitment. From there it goes through four stages.
Weeks 1–6: accumulating data. Campaigns gather statistics and automated strategies settle into their working mode. Comparing actual CPL against target during this period is pointless — look at conversion volume and traffic quality, not at cost.
First revision against actuals. Once CPA stabilises, three numbers get checked: the real CPL, the real junk lead share and the real close rate on leads from advertising specifically. Very often this is where it turns out the input close rate was estimated optimistically — and the target is adjusted not because the advertising is bad but because the model has become more accurate.
Regular assessment on trend. A 15% month-to-month swing is normal, and reacting to every such swing with account changes is harmful: the algorithm re-enters learning each time. The working unit of assessment is a quarter, or a rolling 8–12 week window.
Quarterly review of the economics. Cost of goods, average order value and the composition of variable costs all change. A KPI calculated in January on January’s margin may by July be either too soft or unreachable. The recalculation uses the same formulas with fresh inputs.
And the basic rule underneath all of it: you can only commit to what you control. An agency controls campaign structure, keywords, bids, ad copy and how it works the auction. It does not control your margin, your sales team or your competitors’ behaviour. Separating those zones is what makes a KPI conversation concrete instead of an exchange of promises.
Reduced to a list, this is the set we request from a client before running the calculation — and if something is missing, obtaining it becomes the first task rather than a reason to postpone the exercise.
| Data | Where it comes from | What to do if you don’t have it |
|---|---|---|
| Average order value | CRM, accounting, 3–6 months of statements | Derive it from quarterly revenue and order count |
| Unit cost of goods | Purchase prices, service costing | Take the three best sellers and weight by share |
| Variable costs per order | Logistics, payment processing, packaging, returns | Estimate on the high side; better overstated than missed |
| Return rate | CRM, accounts | Use an industry reference and verify in 2 months |
| Junk lead share | CRM statuses | Introduce statuses before launch; use 25–30% meanwhile |
| Close rate on qualified leads | CRM, paid traffic separately | Take the overall close rate and cut it by a third |
| Repeat purchase share and horizon | 12-month cohort report | Leave LTV out of the calculation entirely |
| Landing page conversion on paid traffic | GA4, separate segment | Configure analytics before launching campaigns |
| Seasonality | Two years of monthly sales | Google Trends as a rough substitute |
| Geography and constraints | The business | — |
Half of these fields take an hour to fill in. The other half is the part that usually does not exist — and it is that half which determines how much any target can be trusted.
A realistic KPI is derived from the economics of the business, not from a desired figure or someone else’s case study. The order is: contribution margin in currency → end-to-end lead-to-sale conversion → allowable CAC as a share of margin → allowable CPL → ad-budget and full CPL from the auction side → the range of leads a given budget produces. Do not mix the two costs per lead: volume is calculated from the ad budget, while the ceiling is compared against the full cost.
The whole method on one screen, with the figures from the worked example:
| Step | What we calculate | Formula | In the example |
|---|---|---|---|
| 1 | Contribution margin | order value − cost of goods − variable costs | 16,200 UAH |
| 2 | End-to-end conversion | (1 − junk share) × close rate | 24% |
| 3 | Target CAC | margin × share allocated to acquisition | 4,860 UAH |
| 4 | Allowable CPL | CAC × end-to-end conversion | 1,166 UAH |
| 5 | Overhead coefficient | total spend ÷ ad budget | 1.25 |
| 6 | Ad-budget CPL | CPC ÷ landing page conversion | 1,000 UAH |
| 7 | Full CPL | ad-budget CPL × overhead coefficient | 1,250 UAH |
| 8 | Verdict | full CPL against allowable | +7% — it holds |
| 9 | Enquiries per month | ad budget ÷ ad-budget CPL | 83–118 |
If the two models meet, the target is fixed inside the corridor and revised against actuals after 4–6 weeks. If the gap is a multiple, the problem is not in the advertising but in the economics, and the work belongs to conversion rate, order value or a narrower segment.
We go through this calculation with every client before signing. If you would like to work out your own numbers together, get in touch and we will check your expectations against what we actually see in your niche. To see how it looks in practice, browse our case studies, and our pricing page covers the cost of the work.