*updated on 24.06.2021
In May 2019, I tested the hashtag promotion method on Instagram. As it happens, it still works. Today I will check whether Instagram tools will work to increase engagement in stories.
Engagement is the top-ranking factor on Instagram. According to the official version of the app:
Engagement – the ratio of the number of “Likes” to the comments of publications.
In fact, when calculating engagement, likes, comments, shares and savings of the post are taken into account. The higher these rates, the higher the coverage. The more people will see the profile and content. This is about posts. What is Story Engagement?
Story engagement is the time the user spends interacting with the story.
Therefore, bloggers and brands are trying to engage users in Instagram Stories – to increase the time that people devote to watching stories. After all, some people watch only stories, not feed. Ideal photos and videos are not so important for stories – these are snapshots, for which Instagram was initially created.
According to a joint study by Buffer and Delmondo, 500 million followers view Insta Stories, with a Stories view rate of over 50%. On top of that, the stories are located above the feed, and immediately catch the eye when entering Instagram.
Previously, stories were shown in chronological order. Now, content in Stories is also ranked by the number of impressions and comments received like in the feed.
What actions are expected from viewing Instagram Stories?
User feedback. These are the standard supposed reactions of people to the life of an account. This is how the profile progresses naturally and the reach grows.
There are additional interactive tools in stories – stickers that the service offers itself.

Fig. 1 – Instagram Stories Tools
They involve the use of a sticker: choosing an answer option, writing something in the feedback window, going to the mentioned account, etc.
Why are interactive stickers useful:
More responsiveness, more engagement.
Works in conjunction with brand presence on Google My Business.
Upon a click on a tag the visitor is redirected to a page with photos of users who also marked this location. There are 3 advantages:
In this case, a map is displayed in the middle of the screen. User moves to Google Maps upon clicking on the map.

Fig. 2 – “Geotag” Tool
The benefits of geotags:
At the same time, the content gets into the story of the city or the specified place. This way the story gets even more views. As the story from the example above – the blogger’s post was available in the stories of the National Botanical Garden of Kiev.
Tag bonuses:
The main benefit of this tool is the likelihood of the publication being viewed by the mentioned account.
Pros:
What does this give me – an ordinary user who has tagged a brand or an influencer?
Repost stories on the company’s Instagram profile. So this is the likelihood of other users viewing my page. Either a discount or some kind of free stuff for your feedback (it happens rarely, but why not?).
An example is a post-question from the manager of Kiev (guide) Yulia Bevzenko@yuliabevzenko, the author of the project @shukay.kyiv:

Fig. 3 – “Mention” Tool
Then the girl tested the coffee shop. I was satisfied with the result and reviewed and advertised this place.

Fig. 4 – “Mention” Tool
Here we used 2 tools at once: a sticker-question and a clickable mention in the text.
The result is a whole fascinating story. Even those users who did not plan to visit the location looked at the interior and the menu. Plus got positive feedback from an unbiased visitor.
Hashtags are of 2 types:
These hashtags collect user generated content (UGC). It turns out the so-called gallery of photographs of a certain subject. For example sunrise/sunset, greeting message, seasons, etc.
An example is the constant heading #jokes from beauty blogger Lisa Krasnova @totallyblond. By the way, subscribers often send content for this to Lisa.

Fig. 5 – “Hashtag” Tool
Pros:
This is if the mention is positive. If the review is negative, you need a brand reaction and work with SERM (in June I just wrote about the correct SERM in search results).
It is too likely that after the situation is resolved, a disgruntled user will post the correspondence with the brand further in Insta Stories (like a nail polish maniac, once a month I consistently observe clashes between bloggers and just users with TM and online stores). This will either form a positive/neutral attitude towards the brand, or destroy the entire reputation of TM.
*Bloggers (and not only bloggers) willingly share any experience of communicating with brands. Especially with negative ones.
It’s great to start the author’s tag, the photo confirmation of which can then be found in the feed. See how the SMM member of the Muse group did a great job: the guys were on tour in the summer and invited fans to mark themselves on Instagram with the special tag #simulatedmusers. After the manager repost the user photos in the group’s account story:

Fig. 6 – Using the author’s hashtag
And if today you drive #simulatedmusers into Instagram Search, then photos from user profiles will also appear. I think this is a great solution, right?

Fig. 7 – Author’s tag from the feed
Or such an option performed by Rammstein, tag #rammstein2019:

Fig. 8 – Author’s time tag in Stories
Now there are already a lot of extra photos, but during the summer tour everyone could watch video from the performances, listen to live performances and see the group’s fire show.
The clearest tool. Requires not only viewing history, but also active interaction with it.
Pros:

Fig. 9 – “Poll” Tool
And even here you can fantasize – instead of the typical "yes/no" write detailed or humorous formulations. The same brothers Kochut:

Fig. 10 – Variations of the “Poll” Tool
The question field contains 80 characters. Anything bigger is visible to the owner of the account, but not visible when the answer is published in story. This must be taken into account.
At the same time, incognito is partially preserved. After showing the sticker with the Question, users will only see the avatar of the user account who asked the question or wrote the answer.
Also, you can share several stickers and answers to Questions at once.
This is the most popular tool among bloggers to increase engagement.
How?
“Share this answer” – download the story – upload the story as a new image in the story – share the next Reply.
Questions are the broadest field for communication, it is provide:

Fig. 11 – “Question” Tool
Moreover, in the "Questions" field, you can even arrange a vote.
See what an interesting step – this is what Anna @orelanna did:
This is how each follower who voted influenced the choice of the print option and saw the result of his work.

Fig. 12 – Voting in the Question
This move performed 2 functions at once:
The result of working together:

Fig. 13 – Voting result
In the same way, subscribers voted for the autumn collection of badges and stickers.
The tool assumes the interest and action of the user, involvement in the story.
You can select the background and emoji to be used in the scale.
Maximum text length – 35 characters.
Pros:

Fig. 14 – “Slider” Tool
The voting sticker has the same great potential as "Questions". But in addition to creating tests, you can run a poll with a maximum of 4 answer options, and then count the votes.

Fig. 15 – “Test” Tool
Because of the game element, the tool engages users well.
You can think over a few moves and entertain the subscribers with the game, as was done by "Vidavnitstvo Starogo Leva":

Fig. 16 – Play in the "test"

Fig. 16 – Play in the "test" (continued)
And 8th, an additional tool that is getting more and more popular.
When using custom masks, the creator of the above is listed at the top of the story and his nickname is clickable. Mask requests are on the rise – many celebrities and bloggers have their own face masks.

Fig. 17 – “Mask” Tool
Please note, the 3rd profile is the Ukrainian travel blogger @juli_berk, and the last account is our retail @prostor_ua – they offer full makeup (even out the skin, shadows + arrows on the eyes, lipstick).
What is a mask for?
What’s the use for the user?
For a blogger– priority of a sample or a personalized mask, advertising of the mask author and monetization.
For a brand – digitalization of goods (cosmetics, accessories) and fitting. Hereinafter – online sale.
For a designer – searching for new clients.
A tool for masslooking stories was introduced in the summer when each user had crazy statistics for stories (for example, the stories in my account collected up to 220 views against the usual 80). There was fought against masslooking, and the algorithm for issuing Stories was updated on the 20th of October.
What’s the new way of working?
If the user did not watch the story but swiped to the left to the story of the next account, the previous account flies to the end of the list. And if this person posts a new story, the profile with overlooked stories will not move to the beginning of the feed, as it was before. And if the overlooked stories disappear due to time constraints, then this account will still go to the beginning.
This means that the views of stories have returned to real numbers – the number of live subscribers who watch stories and are involved in the life of the account.
Now I will check all the tools on my profile – it is an ordinary one, without paid ads and other.
Can I get more engagement with stickers? I’ll connect a business account for a while and take into account extended statistics data.
What metrics are recommended to target at Buffer.com:
SMM experts advise you to post a story every day. I will try to adhere to this recommendation. Let’s see if engagement tools work for me, a non-blogger.
Profile Instagram — my personal account with my target audience.
Content topic – at my discretion.
Posting time – based on the Buffer recommended by research.
Duration – 2 weeks (6 – 20 March).
Buffer provides such a graph of the effective viewing time of stories (according to the USA):

Fig. 19 – Effective watch time graph
Productive Time (Descending, USA / Ukraine):
Taking into account the amendment of +8 hours for local time, it can be seen that the time of shows is also relevant for Ukraine. Except for the last one, it is still working hours.
I will try to post a story within this period. A number of publications per day – 1 and above.
Object – video from the Lindemann concert on March 6, 2020 in Kiev;
Location– concert venue StereoPlaza, I mark it with a tag.
Posting time — 10-12 pm.

Fig. 20 – Using geotagging
Reaction:

Fig. 21 – User reaction to geotag
Views – 73.
The story got into 3 stories of the location: “Stereo Plaza”, “Stereo Plaza Kiev” and “Stereo Plaza”, which were viewed by 25 viewers.
Benefits:
The storyline of the photo – congratulations by ITForce employees on March 8.
Time – 9 – 11 am.
Tag the @itforce profile and check the reaction.
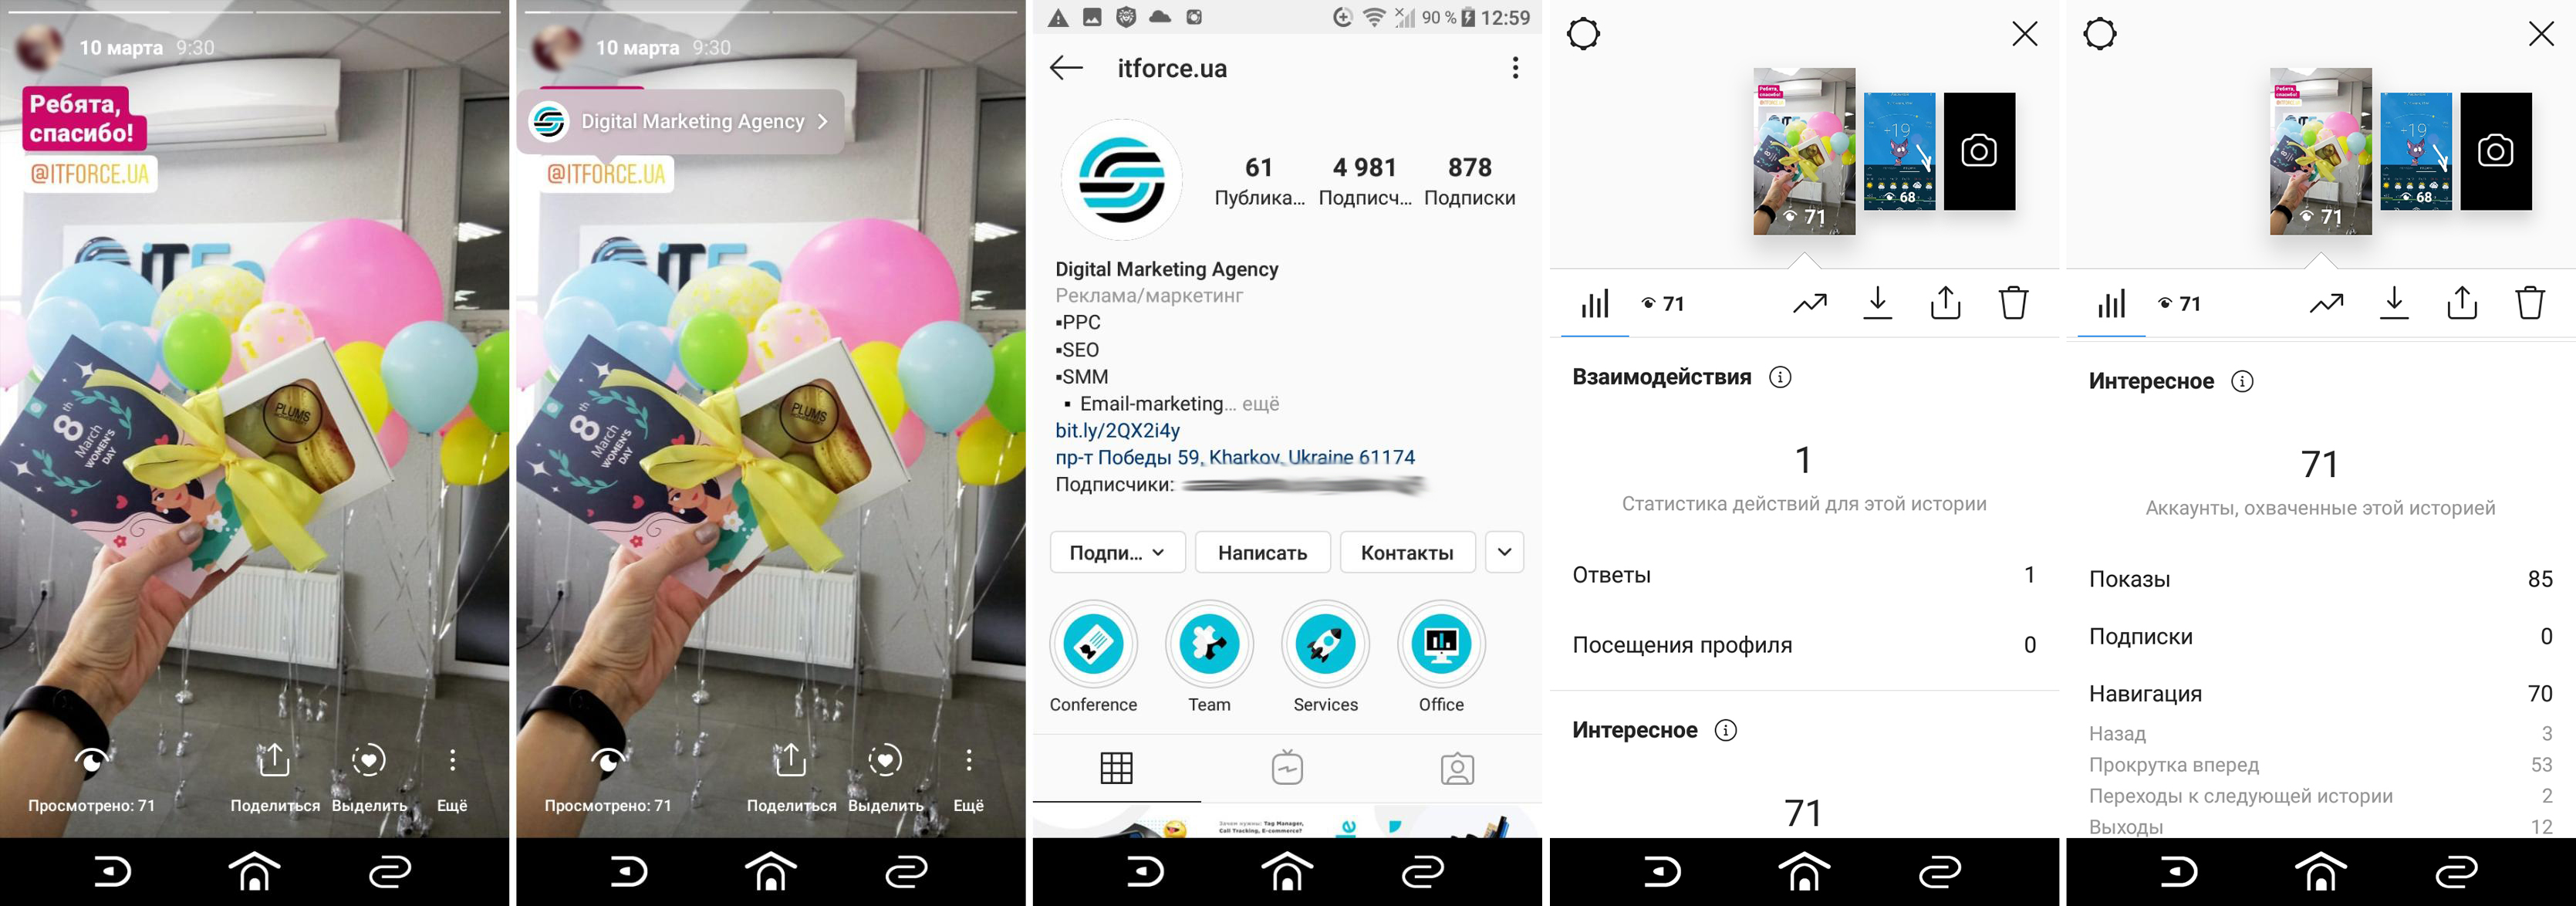
Fig. 22 – Usage and reaction to mention
Reaction:
Views – 71;
Replies – 1.
Benefits:
One of the most popular hashtags is #sunset.
The storyline of the photo – sunset.
Posting time – 4-6 pm.
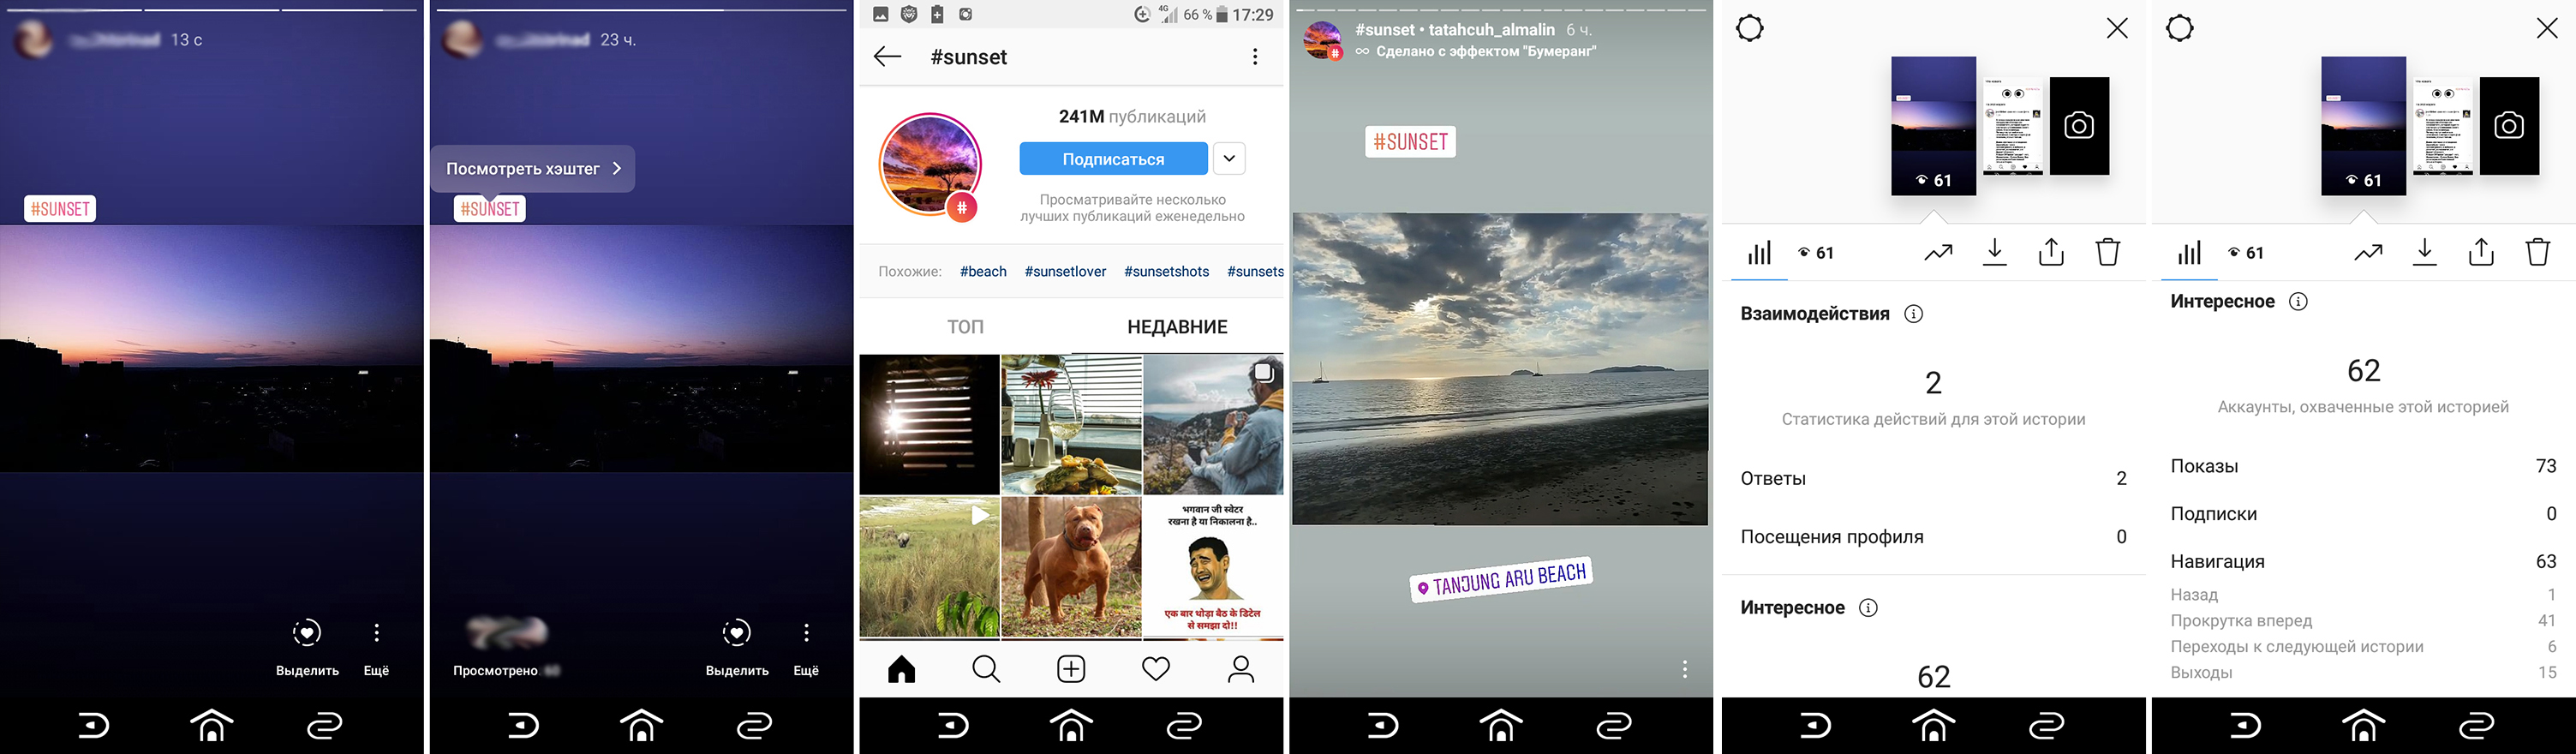
Fig. 23 – Hashtag usage and reaction
Reaction:
Views – 62;
From the hashtag – 0;
Replies – 2.
The number of publications under the #sunset tag is 241 million. Obviously, the tag is quickly filled with new photos and few people scroll through all the stories.
Benefits:
The storyline of the photo – question about random funny photos, start voting.
Posting time – 12 -2 pm.

Fig. 24 – Usage and user response to the poll
Reaction:
Views – 81;
Replies – 17 “yes”, 0 “no”.
Benefits:
Storyline – please advise films/series in the spirit and atmosphere of "The Hunt" and "The Bridge".
Posting time – 12-2 pm.

Fig. 25 – Using Question
Reaction:

Fig. 26 – User reaction to the “Question”
Views — 73;
Replies – 21 (of which 7 are spam messages).
Now, I can write a post with a selection of film adaptations based on what was advised. And in the post, re-ask the opinion of the subscribers, since not everyone watches the story.
Benefits:
Storyline – again a photo from an attended Lindemann concert.
Time – 10 -12 pm.

Fig. 27 – Using and responding to the Slider Tool
Benefits:
The storyline of the photo – manicure with a new varnish.
I offer subscribers 4 possible answers (1 correct). Moreover, the shades are selected similar, so that it is more difficult to determine the correct option (4th).
Time – 10 – 12 am.

Fig. 28 – Use and response to "test"
Reaction:
Views – 69.
Benefits:
Advanced statistics offers 16 metrics to analyze the effectiveness of your stories. I took into account only 10 relevant to me (as it turned out later, 8 is the optimal set):
*SMS, Calls, Clicks on the site, Clicks on the button "How to get there", Click on the link, I do not take into account emails, these tools were not used, there are zero statistics.
First, I look at the statistics BEFORE using the tools:

Fig. 29 – Initial statistics

Fig. 30 – Initial statistics (continued)
I put it in a table and analyze the indicators (I spied on the method from Ilya Slyusarev from SMMPlanner):
ER is an indicator of content engagement. I divide positive reactions by coverage.

Fig. 31 – Source analytics metrics
For the last 2 columns, I have added all the indicators of 6 stories to have a total figure. Total, total % of story revisions = 192, and ER = 38%.
Now I take data AFTER using the tools:

Fig. 32 – Statistics on the use of the "Geo" and "Slider" tools

Fig. 33 – "Geo" and "Slider" tool usage statistics (continued)

Fig. 34 – Usage statistics for Mention, Hashtag and Poll tools

Fig. 35 – Usage statistics for "Mention", "Hashtag" and "Poll" tools (continued)

Fig. 36 – Statistics on the use of the "Question" and "Test" tools

Fig. 37 – Statistics on the use of the "Question" and "Test" tools
I put the data in a table to make it easier to analyze.

Fig. 38 – Statistics after using Instagram tools
118 impressions received a story from the Lindemann concert (geotag instrument), she also has the most fast forward.
6 users wished to return to the previous stories – and again this is the "geotag" tool (in the previous stories I published a video with the opening act of Jadu and Aesthetic Perfection before the concert, people wanted to watch it).
2 replies – story with hashtag.
The best coverage of 81 Stories with a yes/no survey.
1 visit to the profile of the stories with a survey, a question and a test.
Again counting % revision and ER. Moreover, it is not clear what the ER rate should be. I will assume that the higher the better. Total:
Compare revisions and ERs before and after:
There was % of Stories revision = 192, and ER = 38%.
Now % of story revisions = 230, and ER = 39%.
Well, does it make sense to bother and use Instagram tools to increase engagement? After all, the difference between the indicators is small. The ER hasn’t changed at all. Did I fail an experiment?
No. First, I tried all the interactive tools of the service.
Secondly, I got creative – I had to come up with content for each sticker.
Thirdly, I got more interactions with stories: views, responses in stickers and in Direct.
Which tools brought the best result:
The most stupid hashtag turned out to be.
The quiz, question, and slider increase the engagement of the profile and subsequent stories if they are responded to. Geotags and hashtags are only those where they are used – by tags you can find similar stories. So, interaction with buttons of polls, votes, etc. increase the ranking of stories.
What can I recommend:
Each specific profile will have its own methods of increasing engagement: you need to be creative, try, test tools and content. This is the only way to understand what works in your topic.
The main thing is interesting content. And each profile has its own “interestingness”, because each niche has its own thematic (or not) target audience. Ask your subscribers (and at least through the Question, not Direct) what they would like to see in your Stories. Today users are the king of consumption, no subscribers involved – no sales.
And, of course, it is better for ecommerce accounts that their account is mentioned as often as possible – this is how the referrals grow.
Try to work with your followers’ photos. In the next month, it will be very useful in an emergency in Ukraine.
Test Instagram tools, engage users!