


The promotion objective is to drive the website into the TOP-10 search results for a defined set of queries, with a particular focus on mid-frequency (MF) keywords targeting positions 5-7.
The promotion goal is to achieve consistent, positive ranking dynamics for target queries across priority regions. The ultimate aim is to establish brand visibility around specific events and services featured on the site, driving relevant organic traffic.
About the Client
Internet-Bilet is one of Ukraine's leading national ticketing operators - a full-scale aggregator platform specializing in online ticket sales for cultural, entertainment, and educational events.
- Core product: tickets for concerts, theaters (opera, ballet), children's shows, sporting events, festivals, masterclasses, and stand-up comedy.
- Infrastructure: alongside the online platform, the network operates physical box offices across numerous Ukrainian cities, building trust with more traditional audiences.
- Website functionality: a large-scale architecture structured by city, genre, and event category; personal user accounts; advanced filtering and seat selection via interactive venue maps.
The primary KPI we defined was the ranking dynamics of target queries across priority regions.
Niche and Competitor Analysis
The ticketing retail market is divided among several major players (Karabas, Concert.ua, Kontramarka). Competition in the niche centers around exclusive contracts with event organizers and website UX quality.
Studying competitors allows us to avoid their mistakes and turn their miscalculations into our opportunities. Key takeaways from our analysis of the client's main competitors:
- The leading competitor has significant issues with language versions. A large share of traffic is being routed to the Russian-language version - a risky position in today's Ukrainian market, indicating misconfigured hreflang tags or redirects. This competitor holds the oldest domain in the niche (21 years). Their strategy targets broad, high-frequency queries with nationwide coverage achieved through subdomains.
- The second competitor is a strong player focused on dedicated pages for specific artists and major tours. This generates powerful but short-lived traffic spikes. Their strategy highlights the importance of fast indexing for new events, while simultaneously making them dependent on high-profile announcements. They operate on a single domain without subdomains, and thanks to a branded keyword in their domain name, they dominate searches containing the word "concert".
- The third competitor is strong in major cities (Kyiv, Lviv, Odesa) but less active in second-tier regions, leaving room for growth. They show the strongest growth trajectory and the lowest dependency on seasonality. Their technical optimization is solid - well-structured filters and internal linking.
- The fourth competitor shows weak conversion and visibility metrics. They have a strong backlink profile but low query relevance, which undermines the commercial value of their traffic.
Current State of internet-bilet.ua
According to Ahrefs data, the site had experienced an abnormal traffic drop and loss of key rankings, pointing to technical errors and insufficient on-page optimization. The primary limiting factors were:
- Semantics - inadequate coverage of target queries.
- On-Page - weak internal optimization and technical errors.
- Link Building - a poor backlink profile that failed to offset the decline.
As a result, even seasonal spikes in demand did not translate into the expected traffic growth. The identified issues required immediate attention and informed the development of a new promotion strategy aligned with the client's current requirements.
The site had strong rankings in the Dnipro, Kharkiv, and Poltava regions. Despite ongoing active work, the domain rating (DR 32) was significantly behind the market leaders (DR 67–91).
- Seasonality. The niche has a clear activity peak from mid-autumn through March-April. It is important to prepare the site for this period in advance.
- Site structure. The use of subdomains for cities is generally justified, as they tend to rank better for local queries.
Semantics and Visibility
The client's site ranks for 51,000 queries - significantly fewer than the niche leaders:
- Leader 1 (398,000) - despite a massive keyword pool, this competitor has a large number of low-quality pages. Google rewards quality per page, so optimizing existing pages for mid-frequency queries will deliver better results than inflating the index with empty URLs.
- Leader 2 (137,000) - the closest benchmark in terms of site structure.
- Leader 3 (71,000) - nearer in volume, but with a higher concentration of branded traffic.
The client's site search visibility is significantly lower than that of key competitors, which directly impacts traffic and overall presence in search results. This is linked to narrower geographic and semantic coverage, competitors rank across a greater number of cities and topics, generating a more diversified traffic flow. Only one competitor shows signs of leveraging event-based and branded queries, which produce short-term but noticeable traffic spikes. Analysis of both the competitor landscape and the client's site revealed that, at the time of engagement, the site was utilizing only ~12-35% of the niche's potential. Expanding semantics by creating artist pages and new regional collections was essential.
Link Building
This is the project's weakest point. The client's site has a reasonably high DR by general industry standards, the number of referring domains is twice as low as that of competitors', and even worse than the weakest market leader. All competitors operate within a similar range of referring domains, while the client's count is half that. The insufficient number of external links is the primary reason regional subdomains fail to hold high positions in search results. A low link count gives search engines no confirmation of the site's authority relative to competitors. This calls not only for increasing the number of links, but for prioritizing relevant, authoritative, and topically aligned donors that directly influence search rankings.
- Index efficiency. Rather than generating thousands of empty pages, each page must be relevant, carry unique content, and be technically sound (addressing errors identified in Search Console).
- Relevance. Google favors sites where a higher percentage of pages deliver real value to users. Cleaning up the index and focusing on mid-frequency queries will allow the client to outperform Leader 1 on quality metrics.
The growth potential in this niche is at least 200–300% from semantic expansion alone, bringing the site up to the level of its closest competitors. Through technical optimization and higher per-page quality, the client's site will be able to generate more traffic per unit of content than Leader 1.
We recommended retaining the current geo-targeted subdomain structure rather than consolidating to a single domain, for the following reasons:
1. Subdomains vs. a single domain.
- Regional relevance: Google interprets local intent more accurately when the city is reflected in the subdomain.
- SERP control: it becomes possible to capture more positions in the TOP through region-specific pages.
- Technical clarity: a single robots.txt and sitemap.xml per subdomain simplifies crawling - particularly important for large sites with frequently updated event listings.
- Migration risks: 301 redirects during consolidation are always a gamble, with a real risk of losing 15-20% of traffic during the reindexing period.
2. The backlink mass problem. The client's site is significantly behind in authority, and subdomains can underperform here, as domain weight gets distributed across them.
- The main domain must be as strong as possible to pass authority to subdomains. Since the capital typically generates the most traffic and backlinks, keeping it on the main domain will maximize the site's overall rating.
- Link-building efforts should target not only the main domain but also key subdomains (Kyiv, Lviv) individually, in order to strengthen their standalone authority.
3. Event page optimization (duplicates). Having separate pages for different dates of the same event creates internal competition (keyword cannibalization) and dilutes SEO value. Schema.org (Event) markup should be implemented, it allows all available dates and sessions to be communicated to search engines within a single page, making the SERP snippet significantly more appealing.
4. URL structure and event handling
The fact that new events are added to the same URL is a major advantage for preserving page authority - search engines learn to associate that address with consistently fresh content.
- Authority and signal consolidation. Consolidating under a single host accumulates external links, brand mentions, and behavioral metrics within a unified visibility zone. This reduces link equity fragmentation across domains and eliminates losses from cross-domain 301 redirects. Internal PageRank becomes easier to manage: streamlined internal linking, shorter click chains, and cleaner canonicalization.
- Simplified admin and analytics. A single property in GSC/GA4 instead of multiple, with city-level attribution as a dimension, no referral exclusions, and no cookie conflicts. One GTM container and unified templates speed up releases and reduce the risk of desynchronization. A single robots.txt, one sitemap index, and shared indexing rules improve stability and reduce operational overhead.
- Duplicate and cannibalization control. Within a single host, it is easier to differentiate landing pages by intent and hierarchy ("city - category - venue"), and to centrally manage rel=canonical, hreflang, Title/H1 templates, and metadata. This reduces internal competition between pages targeting the same queries, allows stricter indexing rules (noindex for low-priority facets), and clears duplicates from search results, helping concentrate relevance on the right URLs.
Microsoft Clarity
The implementation of Microsoft Clarity in October 2025 was a step toward a deeper understanding of user behavior on the site. Unlike Google Analytics 4, which provides quantitative data (how many people visited), Clarity focuses on qualitative metrics (how they actually interact with the interface). Specialists are currently analyzing the collected data to prepare recommendations and identify areas for UX improvement.
Why Clarity was implemented:
1. Interaction visualization (Heatmaps). Clarity enables the creation of click, scroll, and cursor movement heatmaps. This is necessary to:
- Verify whether users notice the "Buy Ticket" button.
- Determine how far down users scroll on event pages.
- Confirm the hypothesis that the side menu is drawing attention away from key elements.
2. Session recordings. The tool allows specialists to see the seat selection process on the venue map or an attempted checkout through the user's eyes. This helps identify moments where customers hesitate or encounter technical difficulties.
3. Identifying pain points. Clarity automatically tracks:
- Rage Clicks: when a user repeatedly clicks on an unresponsive element in quick succession.
- Dead Clicks: clicks that produce no action or response.
- Quick Backs: instances where a user lands on a page and immediately navigates back.
4. Conversion rate optimization (CRO). Clarity data serves as the foundation for technical briefs issued to developers. For example, this tool can be used to justify moving the menu to the header or redesigning the session date selector in order to reduce user drop-off at the session selection stage.
A technical and usability audit, along with an in-depth analysis of GSC and GA4, is a mandatory baseline for any project. The success of further promotion and the return on marketing investment depend directly on the quality of this foundation. In the next section, we will cover these key activities and the errors they revealed.
Technical Audit
1. Critical errors
- Incorrect Google Tag Manager placement - the GTM code is implemented incorrectly, causing analytics failures. Scripts must be repositioned according to official guidelines: inside the <head> section and immediately after the opening <body> tag.
- Issues with the online.internet-bilet.ua subdomain - this subdomain, lacking relevant content, is being indexed - creating internal competition (cannibalization) and wasting crawl budget. A 301 redirect to the main domain is required.
2. Important errors
- Session-based page duplication - creating separate URLs for each date and time of the same event fragments SEO potential. A single event page with a date selector (calendar or list view) should be implemented, as seen among niche leaders.
- hreflang attribute errors - the missing x-default tag and a limited set of language tags prevent Google from correctly identifying the site's language versions.
- Incorrect heading hierarchy and duplication:
- Multiple <h1> tags used on a single page.
- Identical <h1> tags duplicated across different pages.
- Skipped heading levels (e.g. H3 without H2) and headings used for non-content blocks.
- Indexation of junk URLs (view_type=outdated) - archived events are entering the index, slowing down the crawling of important sections. These parameters must be blocked from indexation.
- URL case inconsistencies - addresses in uppercase or containing underscores create duplicate content. Unification to lowercase with hyphens is required, along with 301 redirects.
3. Minor and low-priority errors
- Broken links (404 errors) - non-working internal links negatively impact behavioral factors. URLs must be fixed or redirects configured.
- Missing Open Graph meta tags - only the title and description are specified, resulting in incorrect link previews when the site is shared on social media (Facebook, Twitter).
- Using 404 instead of 410 - for permanently removed pages, a 410 Gone response code is recommended to accelerate their removal from Google's index.
- Russian-language labels in RSS feeds - on Ukrainian-language pages, RSS feed links contain the Russian-language headers "Мероприятия" and "Новости."
- Index bloat from archived events - completed events remain accessible through public navigation, requiring archive pagination to be blocked from crawling.
Usability Audit + Filter Recommendations
1. Main menu optimization:
- Moving it to the top - the main menu should be repositioned to the upper part of the page (above the event poster), ensuring it is visible without scrolling on desktop.
- SEO impact - placing the menu closer to the top of the DOM structure will allow search bots to crawl links faster and improve internal linking.
- Mobile version - menu items in the mobile version should be left-aligned (replacing the current right alignment) for better readability.
2. Implementing smart filtering:
- Multi-select (Checkbox) - checkboxes should be used to allow selection of multiple genres simultaneously, giving users flexible control over results.
- Response speed - the filter should trigger instantly upon click (auto-submit) without requiring a full page reload.
- SEO landing pages - when a user selects a genre via a dropdown, they should be directed to a dedicated canonical category page (e.g. /concert) rather than filtered results via URL parameters.
3. Event sorting system:
- Sorting block - a sorting control should be added above the event card grid.
- Sorting criteria - sorting by date (upcoming first, set as default), popularity (based on traffic), and price should be implemented.
- Technical implementation - URL parameters should be used (e.g. ?sort=price&order=asc) to ensure sorting functions correctly.
4. Breadcrumb navigation:
- Navigation - full breadcrumbs should be added to all pages to help users easily return to previous catalog levels.
GA4 Analysis
1. Identified errors and bottlenecks
- Low conversion rate to ticket selection: the current rate is only 35-40%, meaning more than half of users who land on a specific event page do not proceed to seat selection.
- Ineffective main menu placement: the side (left) menu takes up too much visual space and distracts from the main content. Based on analytics data, this accounts for a 10-15% loss in potential clicks.
- Visual noise around CTA buttons: numerous secondary elements are placed alongside the primary purchase button, dispersing user attention.
- Suboptimal "All Events" button link: the current configuration of this button limits the site's SEO potential and fails to deliver the expected full list of current events to the user.
- Lack of purchase button focus on mobile: on event pages (e.g. "Freedom Ballet"), the primary CTA button gets lost among surrounding content.
2. Improvement Recommendations
UI/UX Optimization
- Moving the menu to the header: the main menu should be relocated to the top of the site. This will free up space for content and help users stay focused on ticket selection.
- Event page refactoring:
- Remove unnecessary elements surrounding the "Buy Ticket" button.
- Move the "Hint" button lower on the page and reduce its visual prominence, making it a secondary action.
- Pin the purchase button (sticky button) on scroll, particularly on mobile.
- "All Events" button update: change the target URL to /uk/events/list so that clicking it opens the full event listing rather than a filtered view.
Conversion Rate Optimization (CRO)
- Purchase triggers: add urgency and social proof elements to event pages, such as "Few seats left" or "Popular event today."
- Exit path analysis: identify the pages users navigate to instead of proceeding to ticket selection, and minimize distracting external links at the decision-making stage.
Technical Analytics (GA4/GTM)
- Data collection fix: as the audit flagged a potential GA4 discrepancy, a full audit of view_item and add_to_cart event configurations is required to ensure conversion figures are as accurate as possible.
- A/B testing: run a test with the relocated menu and updated event page structure to validate the hypothesis of a 10-15% conversion uplift.
The site's primary issue is user drop-off at the final step before seat selection. Implementing the interface simplification recommendations - particularly around the menu and CTA buttons - will significantly increase sales volume without additional traffic acquisition costs.
Google Search Console Analysis
1. Identified errors and technical issues
- Pagination indexation issue: pagination pages (page 2, 3, etc.) are effectively blocked from indexation due to a canonical tag pointing to the first category page resulting in lost traffic for specific queries and limiting crawler access to deeper site pages.
- Missing Last-Modified header: the server does not return a correct last-modified date for content, forcing search bots to fully re-crawl pages on every visit, even when nothing has changed.
- Missing breadcrumb structured data: the navigation chain is not displayed in search results, reducing CTR and weakening search engines' understanding of the site structure.
2. Fixes and optimization recommendations
- Implementing the Last-Modified HTTP header - the server should be configured to return the actual date of content changes (synchronized with HTML and sitemap). RFC 7231 format (GMT) must be used - the date should only update when text, metadata, or images are modified, not when view counters or dynamic blocks change.
- Updating pagination indexation logic - the canonical tag pointing to the first page should be removed from pagination pages. Each pagination page must have a self-canonical. Pages from page=2 onward should have the meta tag index, follow. Category description text (SEO text) should only appear on the first page to avoid content duplication.
- Implementing BreadcrumbList structured data - JSON-LD markup for breadcrumbs should be added. Each element in the chain must include a name (page title) and item (URL). The last element (current page) does not require a link.
- Sitemap.xml optimization - the <lastmod> attribute in the sitemap must fully match the Last-Modified header returned by the server.
All errors identified across the audits, those preventing the site from functioning correctly and attracting customers, were documented in detail and handed off to the client's team for review and implementation.
Link Building Recommendations
Based on a comparative analysis of market leaders (Concert.ua, Karabas.com, Kontramarka.ua, Ticketsbox.com), a backlink profile scaling plan was developed.
- Localization and regional authority. To strengthen positions in the Ukrainian segment, the share of links from .ua domains should be brought up to 30%, in line with the backlink structure of top niche players, and to increase search engine trust in the resource.
- Donor quality and platform diversity. The client's site currently holds a significant advantage over competitors: its donor-to-link ratio is considerably cleaner. Competitors show signs of spam through repeated placements on the same platforms. When scaling link volume, repeat placements should be capped at 30%, allowing growth while maintaining a high-quality profile.
- Link types and authority distribution. The current Dofollow/Nofollow ratio is optimal and in line with market averages. This proportion will be maintained to preserve a natural-looking profile. Currently only 2% of links point to the homepage - to achieve the ideal balance, this figure is planned to increase to 3%, following the strategies of segment leaders.
- Anchor profile and link building mix. Analysis revealed a deficit of non-anchor links, creating profile safety risks. A focus on crowd marketing is recommended. Forum and discussion links will account for 70-80% of total link building volume, providing the necessary non-anchor mass and making the profile appear as organic as possible.
Alongside the implementation of technical fixes, an updated link building strategy was presented to the client to improve the site's trustworthiness in the eyes of search engines.
Results
Let's take a look at the project outcomes, reflecting the effectiveness of the chosen SEO approach, and what was achieved through the systematic promotion of the ticketing service.
Link Building Strategy
internet-bilet.ua: +364 domains


The before/after graphs show a positive growth trend in the site's backlink profile from September 2025 through January 2026, with a clear and steady upward trajectory. The link building strategy appears organic to search engines and builds a solid foundation for improving domain authority (Domain Rating) and search rankings.
kharkiv.internet-bilet.ua: +181 domains


The Kharkiv subdomain recorded the highest percentage growth among all locations (as will be shown below). The graph shows two distinct phases of strong growth. The increase from 45 to 226 referring domains brought the Kharkiv subdomain nearly on par with the Dnipro subdomain in terms of profile strength. Given the highly competitive nature of the ticketing niche in major cities, this kind of growth is a strong signal for local SEO.
dnipro.internet-bilet.ua: +56 domains


The graph shows a sharp vertical increase in the first half of December 2025. After peaking in mid-December, a slight drop and stabilization followed through the end of January, a natural process of low-quality and temporary links dropping off. The total number of referring domains grew by nearly one third, positively impacting local SEO in Dnipro.
odesa.internet-bilet.ua: +120 domains


The Odesa subdomain shows rapid growth: the graph displays a sharp vertical spike. Within just one week, the number of referring domains jumped from ~35 to ~130. Ahrefs data indicates that some of these links are spammy, and are already being addressed. Following the spike, the profile has stabilized at a consistent level with minor fluctuations, gradually plateauing at 138 domains.
kyiv.internet-bilet.ua: +102 domains
As one of the largest ticketing services, internet-bilet naturally attracts a significant share of organic links, particularly to the main domain and the Kyiv subdomain, as reflected in the graph (a sharp link spike at the end of November, during the Black Friday period).


From early September through mid-November 2025, the number of referring domains remained virtually unchanged at 125. In the second half of November, a surge occurred and the donor count nearly doubled within a very short timeframe. By the end of January, the graph stabilized at 227 domains, indicating successful consolidation of new positions and strong donor authority. A long-term effect and high search engine trust in the acquired resources is expected.
Organic Traffic
Project traffic acquired over the period 01.01.2025 - 31.01.2026


- 970 005 - total users over the specified period.
- 255 274 - new users (first-time visitors to the site).
- 313 582 - returning users (your loyal audience).
- 3 min 26 sec - average engagement time per active user.
- 2,00 - engaged sessions per active user.
- 19 942 044 - total events recorded on the site (add to cart, proceed to checkout, purchase, etc.), averaging 20 events per user.
The user acquisition graph shows wave-like activity typical of ticketing services. The fact that each user averages 2 engaged sessions with over 3 minutes of interaction time indicates high-quality content that keeps people coming back. The high total event count (nearly 20 million) confirms that the traffic is real and active. The number of key events (5.5 million) relative to total users is strong - each user completes multiple conversion actions over the period, actively browsing the event listings and moving through the seat selection and purchase flow. The number of returning users (313K+) exceeding new users (255K+) indicates that the site is performing well and maintaining strong visitor engagement.
A more precise traffic comparison: 01.09.2025 - 31.01.2026 vs. 01.09.2024 - 31.01.2025:
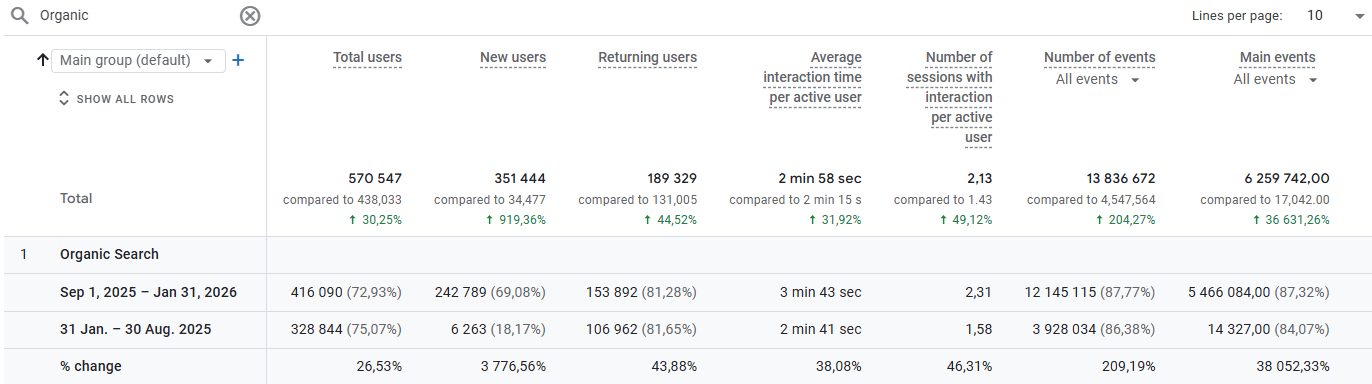
We began working with the site in August, and since the niche's peak season starts in autumn and runs through the end of December, the traffic growth was expected - all key metrics show exponential increases. The peak performance in December resulted from a combination of seasonal demand and a successful SEO strategy. The explosive growth in new visitors (39x) was accompanied by improved behavioral metrics, confirming that the traffic acquired is genuinely targeted, not simply cold traffic. A key event rate of 81.4% is high for organic traffic, indicating that the user journey has become intuitive, while analytics now correctly tracks every stage of interaction. The 44% growth in return visits transforms the site from a one-time destination into a regular tool for audiences, reducing customer acquisition costs over the long term. The site is fully prepared for peak season, demonstrating strong conversion performance and steady growth of its loyal audience.
A more precise traffic comparison: 01.09.2025 - 31.01.2026 vs. 01.09.2024 - 31.01.2025:
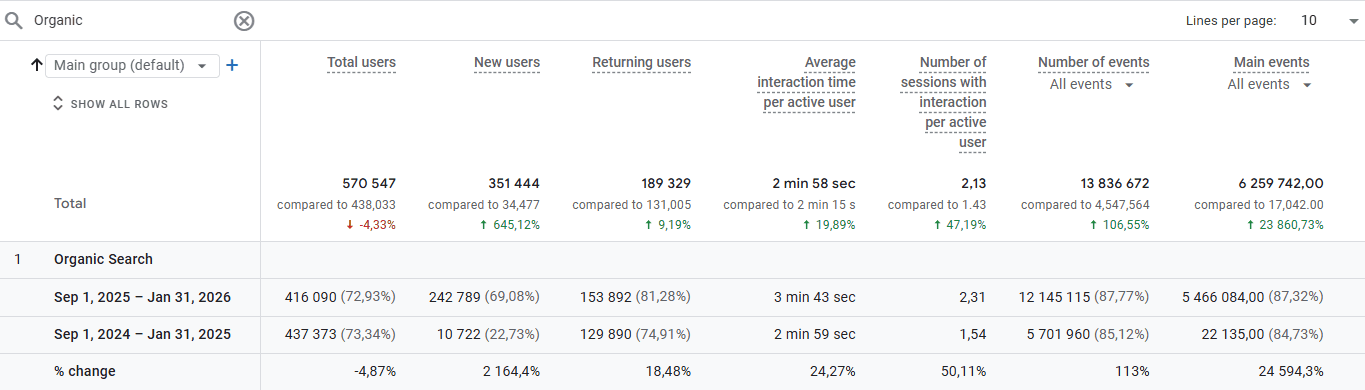
- 242 789 - new users, representing a +2,164.4% increase year-over-year (up from 10,722).
- 81,43% - key event rate, up +1,954.45% from 3.96%.
- 5 466 084 - total key events, a +24,594.3% increase compared to the previous period (22,135).
- 3 min 43 sec - average engagement time, +24.27% above last year's figure (2 min 59 sec).
- 2,31 - engaged sessions per user, up +50.11% from 1.54.
- 153 892 - returning users, up +18.48%.
- 12 145 115 - total events on the site, +113% above the previous result.
A year-over-year comparison of the current season against the same period last year reveals a fundamental shift in site performance - traffic quality and effectiveness have grown by orders of magnitude. The 2,164% increase in new users demonstrates that the SEO strategy successfully reached a previously untapped audience - a direct result of expanding beyond branded queries into broad semantic coverage.
Key Queries and Rankings
Let's take a look at the specific gains achieved in each of the priority cities.
Kyiv: average position +10

Overall, 49% of tracked keywords rank within the TOP-30 or higher, while 43% remain outside the TOP-100. A gain of 31 keywords entering the TOP-10 is a strong positive signal. The resource consistently holds around page 6 on Google.
Lviv: average position +11
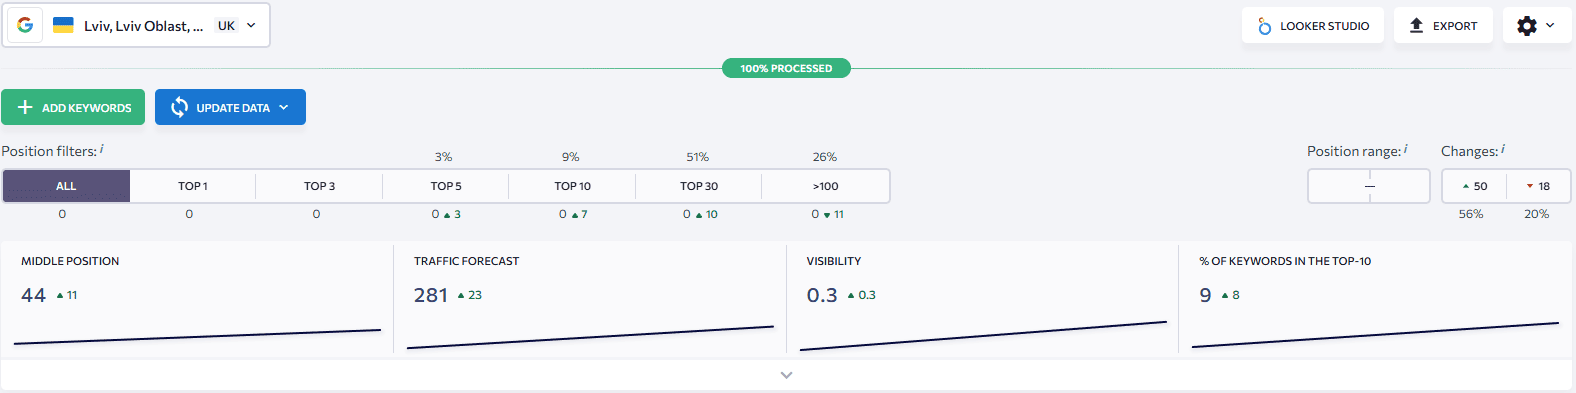
- 44 - average position (an improvement of 11 points).
- 281 - traffic forecast (showing growth of +23).
- 0.3% - visibility, which remains low as the majority of queries have not yet reached page one of Google.
Poltava: average position unchanged
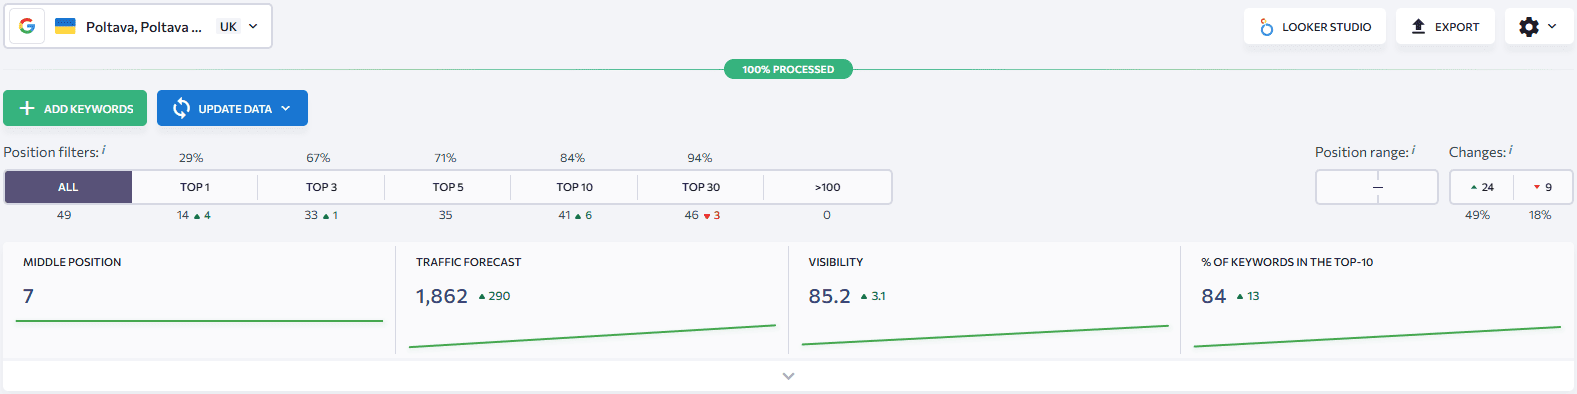
- 1,862 - traffic forecast (growth of +290).
- 85.2% - visibility (the highest visibility score across all cities, up +3.1%).
- 84% of keywords in the TOP-10 (a gain of +13 positions, the strongest result across all tracked cities).
The site is effectively capturing the dominant market share. All tracked keywords rank within the first three pages of search results. 24 keywords (49% of the core set) improved their positions. Only 9 keywords (18% of the core set) saw a decline.
Odesa: average position +2

Odesa shows confident rankings and steady growth. The region outperforms Kyiv and Lviv in visibility but still has room to grow. Queries are visibly transitioning from page two into the TOP-10.
- 14 - average position (an improvement of 2 points).
- 310 - traffic forecast (growth of +181).
- 52.8% - visibility (up +26.4% - the most significant gain).
- 81% of keywords in the TOP-10 (a gain of +14 positions).
33 keywords (79% of the core set) improved their positions. 8 keywords (19% of the core set) saw a decline.
Vinnytsia: average position +3
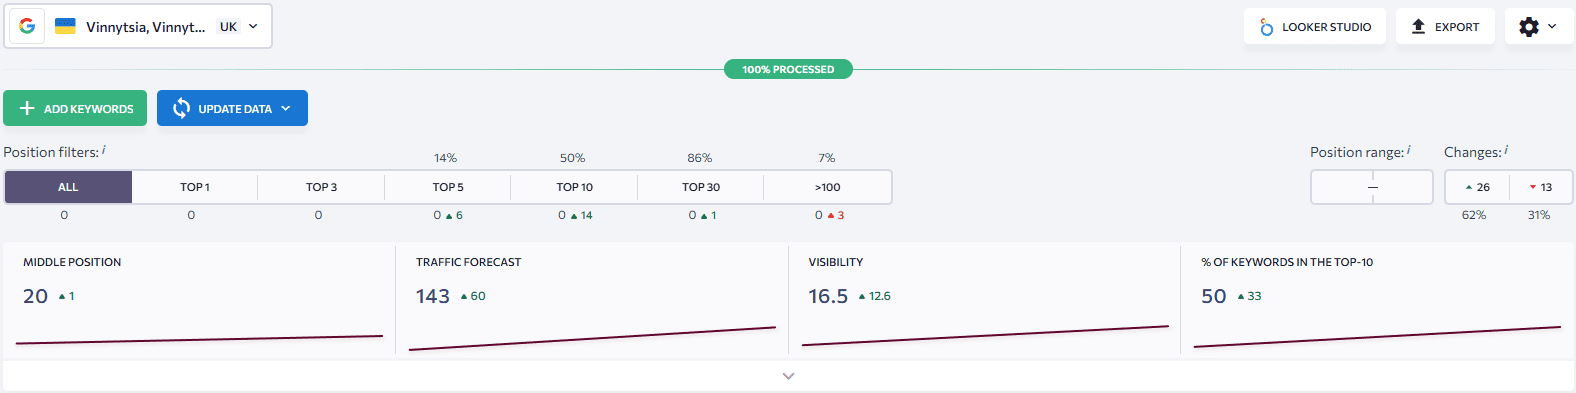
- 20 - average position in search results.
- 143 - traffic forecast.
- 16.5% - visibility.
Dnipro: average position +1
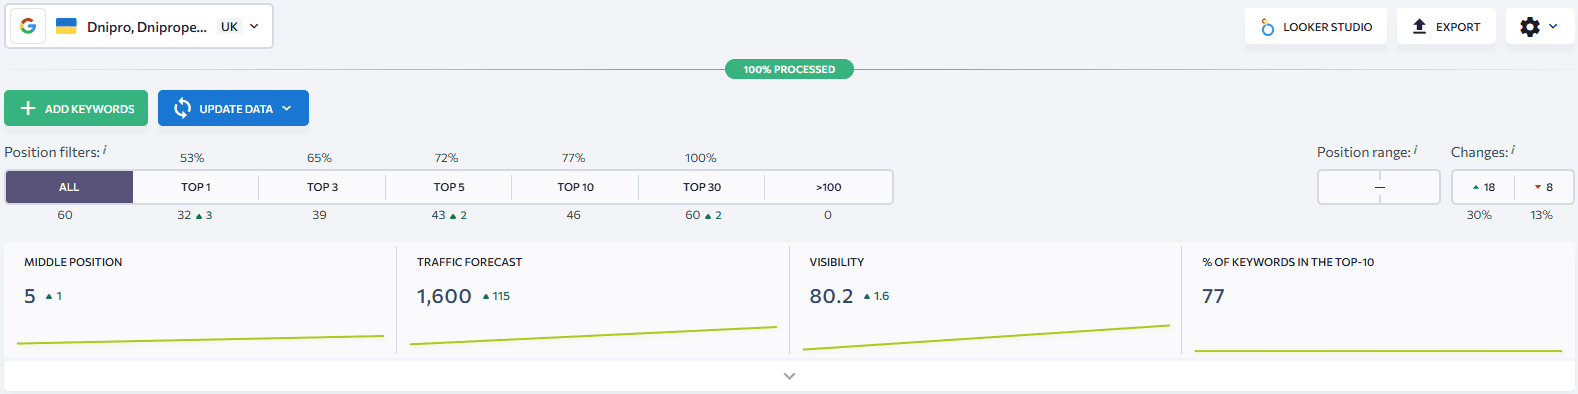
77% of tracked keywords rank within the TOP-10. 53% of queries hold the #1 position in search results. An average position of 5 with 80.2% visibility means the service has effectively monopolized the search results for its target queries. With 53% of queries ranking first, this has driven a sharp increase in projected traffic of +1,600 units.
The chosen link building strategy and focus on regional promotion have not only improved site visibility but also delivered strong ranking dynamics. Depending on the city, between 9% and 84% of keywords now rank in the TOP-10 - driving consistent traffic growth to the main resource. The project demonstrates high page relevance and strong authority across each individual region, which remains our primary objective.